

An experimental workflow for bioprinting optimization: Application to a custom-made biomaterial ink

Bioprinting is an emerging technology with significant potential in biomedical fields, enabling the creation of highly customized, cell-laden constructs. Despite the promise, achieving high-quality, reproducible prints remains challenging due to the lack of standardized protocols, which has hindered the widespread adoption of the technique. In this study, we present a systematic bioprinting protocol designed to optimize the performance of an in-house photo-curable biomaterial ink composed of gelatin methacryloyl and egg white protein. Printing quality was evaluated through the following three key assessments: extrusion, deposition, and printability. To facilitate accurate image analysis, we developed a custom three-dimensional (3D)- printed lens support specifically designed for a USB microscope. Additionally, we implemented a Python script to quantitatively assess bioprinting quality. Our results indicate that a pressure range of 70–80 kPa, combined with speeds between 300 and 900 mm/min, yields reliable extrusion flow, with 75 kPa and 600 mm/min emerging as optimal parameters for bioprinting 3D constructs. These findings underscore the importance of carefully tuning parameters—including pressure and speed—to achieve stable, high-resolution extrusions. Such optimization mitigates common printing issues, including tip clogging, filament dragging, and unintended merging of adjacent filaments, thereby enhancing structural accuracy. This work provides a comprehensive framework for evaluating and optimizing bioprinting parameters, offering a reproducible methodology to enhance print quality. It contributes to ongoing efforts to standardize bioprinting processes and advance their applications in tissue engineering and regenerative medicine.
1. Introduction
Bioprinting is an advanced technology derived from the field of additive manufacturing, popularly known as threedimensional (3D) printing, and serves as a fundamental technique in tissue engineering by fabricating complex 3D structures that mimic the architecture and functionality of natural tissues and organs.1 Despite being a relatively new technology,2 bioprinting has witnessed significant advancements over the past two decades, driven by the efforts of researchers worldwide and attracting growing interest in the healthcare field.3 These developments have led to notable achievements, including the creation of personalized tissue models, such as perfusable cardiac patches,4 and improvements in drug screening and disease modeling, facilitated by the precise positioning of cells and spheroids.5 Moreover, bioprinting has emerged as a transformative tool in regenerative medicine and cell therapy, enabling the development of patient-specific autologous tissues and organs.6 This technology has also played a pivotal role in advancing drug and vaccine development, contributing to the creation of sophisticated in-vitro models for virology research.7 As the field continues to evolve, it faces growing attention to intellectual property (IP) concerns, particularly around patenting proprietary biomaterial inks, bioprinting hardware, and digital design files derived from biological data.8 Addressing these legal and ethical challenges—balancing innovation with commercialization and equitable access—is critical for ensuring continued growth in bioprinting technologies. Indeed, this focus on IP is underscored by the dynamic expansion of the global 3D bioprinting market, valued at approximately USD 2.3 billion in 2022 and projected to grow at a compound annual growth rate (CAGR) of 12.5%, reaching an estimated USD 5.3 billion by 2030.9
The widespread adoption of bioprinting technology has led to the diversification of printing techniques across research groups.10 In the absence of a commercially available “universal” biomaterial ink,11 capable of supporting a broad range of cell types while maintaining mechanical properties suitable for printing and post-printing processes, researchers have developed tissue-specific biomaterial ink formulations tailored to their needs.12,13 Consequently, the bioprinting field is characterized by a wide variety of biomaterial ink formulations, each requiring comprehensive characterization. Profiling these biomaterial inks is inherently challenging due to the variability introduced by their distinct material compositions and applications. This variability is further compounded by batch-to-batch inconsistencies produced from multiple factors.14 These include differences in the source of animal-derived materials,15,16 variations in animal age,17 the bloom number,18 or the synthesis method employed.19
These factors collectively highlight the critical need to develop and adopt standardized methodologies to evaluate and compare biomaterial inks. Standardization would enable consistent benchmarking of biomaterial ink properties, enabling their optimization and enhancing reproducibility across studies and laboratories. The publication of the “ASTM F3659-24 Standard Guide for Bioinks Used in Bioprinting” in April 2024 marked a significant step toward the formalization of definitions and terminology in the field, particularly for extrusion-based bioprinting.20 While this standard establishes a useful conceptual framework, it does not yet provide specific protocols or quantitative criteria for assessing printability or guiding experimental procedures. While efforts to establish formal standards, such as ASTM WK65680 or ASTM WK72274,21 are currently underway, their final publication is still pending. Therefore, several research groups have proposed different methodologies to analyze bioprinting quality.22 These approaches primarily focus on the degree of dimensional fidelity of the printed construct relative to its designed geometry. A variety of tests have been proposed to evaluate bioprinting performance, focusing on different parameters, such as fiber formation,23 uniformity value,24 filament fusion,25 collapse resistance,26 layer stacking integrity,24 printability index,27 and the ability to replicate complex geometries.28 Other research groups, such as Rodríguez-Rego et al.,29 have proposed evaluating bioprinting quality through a combination of multiple tests. However, the methodologies employed by these groups often require specialized equipment to assess parameters, such as drop angle,29,30 or assess similar printing characteristics.31,32 To address these limitations, theoretical models have been introduced to aid in printing predictions. For instance, Bonatti et al.33 proposed an open-source computer-aided design - computer-aided manufacturing (CAD-CAM) simulator that integrates a mathematical model to predict printability and optimize extrusion-based bioprinting. Their approach provides a valuable framework for evaluating printability through simulation, contributing to process optimization and reproducibility. While our methodology follows a different workflow, it aligns with the broader objective of improving bioprinting assessment. Rather than relying on simulation, we propose an experimental approach based on three specific tests—extrudability, filament deposition, and printability—combining key printing elements while omitting redundant or less critical evaluations.
The first test is extrudability, which evaluates the hydrogel solution flow at the nozzle outlet. Traditionally, this has been conducted using qualitative visual analysis of filament morphology.23,34 Quantitative methods, such as measuring the extruded solution volume35 or scoring the filament morphology at the nozzle outlet,36 have been proposed. However, these methods often encounter challenges, including difficulties in accurately imaging the filament during extrusion and inaccuracies in volume and density measurements caused by variations during crosslinking or syneresis.37 To overcome these limitations, we propose an alternative approach, quantifying the mass deposition rate under varying printing pressure conditions. This enables the identification of optimal pressure values for achieving consistent extrusion.
After determining the optimal pressure values, the second test focuses on filament diameter optimization. The filament deposition test aims to achieve a filament diameter closely matching the nozzle tip diameter. Previous studies have evaluated filament uniformity by printing straight lines and manually measuring hydrogel outline length at both sides24 or by printing S-shaped structures and measuring filament diameters at specific points.38,39 However, these methods often analyze only a portion of the printed construct. To address this limitation, a monolayer structure is printed and analyzed, measuring filament diameter across the entire construct under varying combinations of pressure and printing speed. This comprehensive approach ensures a more accurate assessment of filament fidelity.
The third test is the printability test,27 which evaluates structural fidelity in a 3D multilayer construct, widely employed by many research groups to assess pore morphology in multilayered grid structures. Alternative approaches include the filament collapse test,26 which evaluates a filament’s ability to form stable layers without deformation under the weight of subsequent layers, and the filament fusion test,25 which analyzes the merging of parallel filaments at increasing distances to provide insights into shape fidelity. However, the printability test is utilized as it provides a more comprehensive assessment of structural stability, effectively encompassing aspects of the filament collapse test. Likewise, the deposition and printability tests together address the key parameters evaluated by the filament fusion test, rendering its inclusion unnecessary within the proposed framework.
In summary, this study introduces an innovative standardized framework that integrates three distinct bioprinting tests—extrudability, filament deposition, and printability—to comprehensively assess printing quality and optimize printing conditions. A key contribution of this work is the systematic combination of these tests into a unified methodology, enhancing the evaluation of bioprinting performance. The primary objective of this study is to establish a standardized workflow to ensure replicable results and a clear methodology. By applying consistent conditions and procedures, a comprehensive biomaterial ink library can be developed, enhancing printing quality and facilitating the comparison of various formulations and conditions. Furthermore, the study employs a custom-made biomaterial ink formulation based on gelatin methacryloyl (GelMA) and egg white proteins, providing new insights into its printability and structural fidelity. Unlikely conventional approaches that rely on extensive trial-and-error iterations or require detailed rheological characterization, the proposed methodology introduces a structured and efficient workflow that streamlines printability assessments. By integrating customized software for automated G-code generation and high-resolution image-based analysis, as well as a dedicated imaging setup, this approach enhances reproducibility and minimizes subjectivity in evaluating bioprinting outcomes. Additionally, the direct, print-based optimization strategy enables the identification of optimal printing parameters without the need for extensive material pre-characterization, making it broadly applicable across different bioinks and printing setups. This method not only facilitates high-fidelity bioprinting with reduced material waste but also provides a practical, accessible solution for advancing bioprinting research and standardization.
2. Material and methods
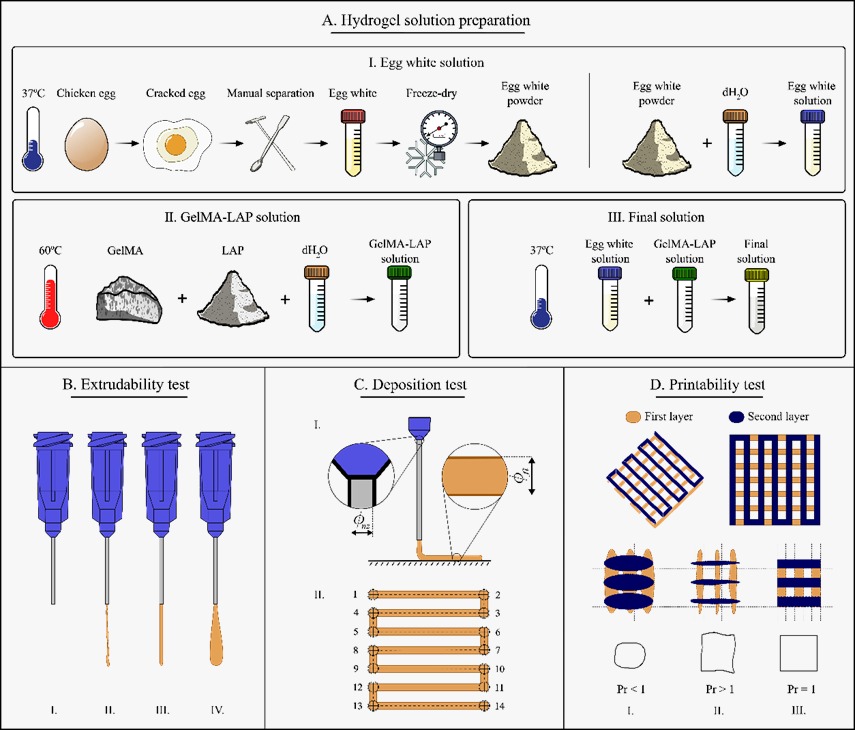
In this work, a custom-made hydrogel solution composed of GelMA and egg white (Figure 1A) is proposed to evaluate our bioprinting protocol. Its preparation is detailed in Section 2.1. The bioprinting protocol consists of three specific tests: extrudability (Section 2.3; Figure 1B), filament deposition (Section 2.4; Figure 1C), and printability (Section 2.5; Figure 1D).

Figure 1. Bioprinting protocol summary. (A) Hydrogel solution preparation: (A, I) egg white solution preparation step, (A, II) GelMA-LAP solution preparation step, and (A, III) final solution preparation by mixing both previous solutions. (B) Extrudability test with the possible extrusion profiles: (B, I) non-extrusion, (B, II) discontinuous extrusion, (B, III) continuous and controllable extrusion, and (B, IV) continuous but uncontrollable extrusion. (C) Deposition test: (C, I) detail comparison between theoretical nozzle diameter (Ønz) and real filament diameter (Øfi), and (C, II) deposition test model to analyze filament diameter. (D) Printability test model composed of two layers with the possible pore morphology: (D, I) over-extrusion, (D, II) under-extrusion, and (D, III) theoretical ideal extrusion. Abbreviations: GelMA, gelatin methacryloyl; LAP, Lithium phenyl-2,4,6- trimethylbenzoylphosphinate.
2.1. Hydrogel solution
A new custom hydrogel solution was prepared, consisting of 10% (w/v) GelMA (Bloom 300, 60% degree of substitution; Sigma-Aldrich, United States of America [USA]), 2% (w/v) egg white (fresh chicken eggs from local farm, Spain), and 0.5% (w/v) lithium phenyl-2,4,6-trimethylbenzoylphosphinate (LAP; >95%; Sigma-Aldrich, USA).
This biomaterial ink was specifically formulated for cell and cancer research, leveraging the unique properties of its components to recreate a functional 3D microenvironment. The principal constituent, GelMA, is synthesized from gelatin through methacrylation, preserving intrinsic cell-adhesive motifs (such as RGD sequences), which provide robust biocompatibility and support cell adhesion, proliferation, and migration.40 To enable rapid photocrosslinking under ultraviolet (UV) light, LAP is incorporated as a photoinitiator, resulting in a stable hydrogel with finely tunable stiffness and degradability rates.41 Additionally, egg white has been incorporated into the formulation to further enhance its biological functionality. Widely applied in the food industry for its gelling, foaming, and emulsifying properties,42 egg white protein has also been demonstrated to produce versatile platforms for 3D in-vitro tissue models and drug delivery systems,43 promoting angiogenesis44 and supporting cell growth and proliferation.45,46
The hydrogel solution was prepared using a twostep process to accommodate the temperature-specific requirements of its components (Figure 1A). In the first step, fresh chicken eggs were processed to isolate the egg white. The eggs were cracked, and then the egg white was carefully separated from the yolk and chalaza (Figure 1A, I), as described previously by Pele et al.46 The egg white was then transferred to Falcon tubes, lyophilized, and the resulting powder was then stored at 4°C for later use (Figure 1A, I). To prepare the egg white solution, the lyophilized powder was dissolved in distilled water at 37°C to prevent protein denaturation caused by elevated temperatures47 (Figure 1A, I).
In the second step, the GelMA-LAP solution was prepared by dissolving lyophilized GelMA in distilled water at 60°C in a water bath, facilitating the melting process. LAP was incorporated during dissolution while ensuring that the Falcon tube was protected with aluminum foil to prevent premature photo-crosslinking due to ambient light exposure. Once fully dissolved, the solution was cooled and stored at 4°C (Figure 1A, II).
Finally, the two solutions were mixed at 37°C using a vortex mixer to ensure homogeneity, resulting in a hydrogel solution suitable for 3D bioprinting (Figure 1A, III).
2.2. Bioprinting parameters
BIO X bioprinter (CELLINK, Sweden) was used, equipped with a temperature-controlled printhead (CELLINK, Sweden). After printing the samples, they were photocrosslinked using a 405 nm UV lamp (Geeetech, China) for 20 s, ensuring that the samples could be manipulated without risking damage to the hydrogel structure and retaining its post-printing morphology at 37°C. The printing conditions are summarized in Table 1.
Table 1. Printing parameters for 3D bioprinting tests
| Printing parameters | Value |
|---|---|
| Nozzle type | Tapered tip (standard) |
| Nozzle diameter (mm) | 0.41 |
| Hotbed temperature (°C) | 10 |
| Printing temperature (°C) | 24 |
| Printing pressure (kPa) | 0–100 (E); 70–80 (D, P) |
| Printing speed (mm/min) | 300–900 (D, P) |
| Retraction speed (mm/min) | 4800 (E, D, P) |
| Layer height (mm) | 1 (E); 0.4 (D, P) |
Abbreviations: D, deposition; E, extrudability; P, printability.
2.3. Extrudability test
During bioprinting sessions, two distinct scenarios can occur based on the amount of material extruded through the nozzle: non-extrusion (Figure 1B, I) and extrusion (Figure 1B, II–IV). This behavior is primarily governed by the intrinsic material properties of the hydrogel solutions, which exhibit non-Newtonian characteristics.48 Specifically, yield stress must be exceeded for the material to transition from a solid-like state to a flowable state.49
When external factors that can induce nozzle clogging—such as partial gelation of the hydrogel solution50 or the presence of significant cell or protein clusters51,52— are absent, the printing pressure becomes the critical parameter for fine-tuning the outcome of the printing process. Once the yield stress threshold is surpassed and the solution starts to flow, three distinct extrusion states can be observed: discontinuous extrusion (Figure 1B, II), continuous and controllable extrusion (Figure 1B, III), and continuous but uncontrollable extrusion (Figure 1B, IV).53 Discontinuous extrusion occurs when the extruded solution forms irregular filaments exhibiting a dripping or jetting behavior. This is typically due to an insufficient extrusion force relative to the solution’s surface tension.54 Conversely, excessive extrusion force can result in an uncontrolled burst of material, resulting in a chaotic solution ejection. Thus, achieving controllable extrusion is a fundamental step in optimizing the bioprinting process.
Consistent and homogeneous extrusion is a fundamental requirement for fabricating successful bioprinted constructs. In this context, extrudability is defined as the minimum pneumatic pressure necessary to achieve consistent and continuous extrusion of the material at a desired flow rate.24 The extrudability value is determined by measuring the extruded solution mass at various printing pressure values (0–100 kPa) over a constant time (3 s), maintaining the printhead static during this printing time.
2.4. Filament deposition test
Following the extrudability test (Section 2.3; Figure 1B), an appropriate range for printing pressure is obtained. However, achieving a successful filament also requires careful consideration of another critical printing parameter: printing speed (300–900 mm/min), which significantly influences the final filament morphology.
Generally, higher printing pressure increases the solution flow, resulting in more deposited material, whereas lower printing pressure reduces it. At a constant printing pressure, increasing the printing speed shortens the time required to travel the same trajectory, thereby reducing the total material deposited. Consequently, higher printing pressures combined with lower printing speeds lead to greater material deposition, while lower printing pressures and higher printing speeds result in reduced deposition. Therefore, achieving an optimal balance between these two parameters is essential for optimizing the material deposition and improving the printing process.
One of the most common tests in bioprinting involves printing a simple, single-trace structure and analyzing the filament width compared to the nozzle tip diameter (Figure 1C, I).55 The selected structure consists of a single-trace filament printed through 14 designated points, resulting in a pattern resembling a square-wave geometry (Figure 1C, II). To assess the filament diameter throughout the construct, an image of the printed filament is first captured (Figure 2A, I) and cropped into the well plate dimensions (Figure 2A, II). This image is subsequently processed to generate a binarized mask of the filament, as described in Section 2.6 (Figure 2A, III). Then, a custom Python script is applied to analyze the processed image by applying the local thickness principle in 2D,56,57 obtaining a fully analyzed filament (Figure 2A, IV).

Figure 2. Deposition test analysis. (A) Filament image capturing and filament analysis steps: (A, I) filament image sampling, (A, II) image cropping and unit scale capturing, (A, III) binarized filament image mask (red box indicates the selected filament section for filament diameter analysis [B]), and (A, IV) 2D local thickness applied to the filament mask. (B) Filament image analysis detailed: (B, I) binarized filament mask definition, (B, II) distance field implementation to the filament mask, (B, III) random point used as reference for measuring the distance to the filament mask border, (B, IV) super-level set filter using the filament mask border distance as a radius, (B, V) Grayscale dilation operation using a circular element at the reference point, and (B, VI) display of the circles that can fit within the filament mask according to the 2D local thickness.
The custom script defines the local thickness LTh(x) by considering the binarized filament mask FBi ⊂ ℝ2 (Figure 2B, I), as the largest radius r of a circle C(c,r), centered at c, which fits entirely within the mask FBi while containing the reference point x. This can be expressed as:
To implement this definition (Equation I), the algorithm computes the distance field D(x), which provides the Euclidean distance from any point x ∈ FBi to the nearest boundary of the mask (Figure 2B, II). Formally, the distance field is defined as:
In this way, D(x) (Equation II) measures the size of the largest circle that can be drawn around x without exceeding the filament boundary FBi (Figure 2B, II). To refine this result, a super-level set Ls (Equation III) is introduced, focusing on regions of the distance field where circles of a given minimum radius can still fit. It is defined as:
This step filters out regions where the distance field D(x) (Equation II) is smaller than the threshold r, ensuring that only significant regions of the mask are considered for further calculations.
The next step involves applying a grayscale dilation operation to the super-level set Ls (Equation III) using a circular structuring element C(r) of radius r (Figure 2B, III and IV). The grayscale dilation is applied to propagate the largest values of Ls (Equation III) within a neighborhood defined by the structuring element. The dilation operation is expressed as:
where, C(x,r) represents the circular neighborhood of radius r, centered at x. The dilation ensures that the maximum value of Ls(Equation III) within the neighborhood is retained, effectively identifying the largest possible radius of a circle that can fit within FBi and overlap with the point x (Figure 2B, V).
Finally, the local thickness LTh(x) (Equation I) is obtained by taking the maximum value of the dilated super-level set (Equation IV) over all possible radii r. This is formalized as:
The resulting value represents the diameter of the largest circle that fits entirely within the mask FBi and includes the point x (Figure 2B, VI).
In summary, the process begins with image sampling (Section 2.6; Figure 2A, I), where the captured filament image is cropped (Section 2.6; Figure 2A, II) and transformed into a binary mask to isolate the filament from the background (Section 2.6; Figure 2A, III). Next, a distance calculation is performed to determine the Euclidean distance from each point within the mask to the nearest boundary (Figure 2B, II; Equation II), providing an initial estimate of the available space around each point. To ensure that only relevant regions are considered, a thresholding step is applied to filter out areas smaller than a predefined minimum size (Equation III). Following this, a dilation operation using a circular structuring element is employed to propagate the large thickness values within a defined neighborhood (Figure 2B, IV and V; Equation IV), refining the measurement. Finally, the local thickness is obtained by identifying the largest possible circle that fits within the filament mask (Figure 2B, VI; Equation V), enabling a precise and reliable evaluation of the filament diameter across all printed models.
2.5. Printability test
Finally, to assess the 3D construct viability of the solution, a printability test27 is conducted based on the viable pressure-speed combinations identified in the deposition test (Section 2.4; Figure 1C). This test consists of evaluating the pore geometry resulting from a multi-layered structure (Figure 1D). The selected structure is a two-layer construct, where the first layer consists of the original deposition test model, and the second layer employs the same model rotated by 90° (Figure 1D).
For ideal printing conditions, the filaments should maintain their structural integrity, forming rectilinear shapes (Figure 1D, III). However, since hydrogels are sensitive materials with different gelation mechanisms, other scenarios may occur. On one hand, when the hydrogel is under-gelated, it will behave like a liquid material, resulting in a filament collapsing and merging due to its reduced stiffness (Figure 1D, I). On the other hand, when the hydrogel is over-gelated, it will act as a solid material, resulting in a heterogenous broken filament due to its elevated stiffness (Figure 1D, II).
Therefore, considering the possible outcomes, the best way to measure the filament integrity is by analyzing the pore geometry obtained by stacking different layers and measuring its circularity. Consequently, the printability value is calculated as a correlation between the expected and the real circularity value of the different pores,27 using the following equation:
where C is the enclosure pore circularity, S represents the pore area surface, and P denotes the pore diameter. Considering a perfect gelation state, the pores formed by the stacking of multiple straight lines will exhibit a square shape (Figure 1D, III). Accordingly, adapting the circularity expression (Equation VI) to this square geometry with side length L, the following equation is obtained:
Correlating this ideal circularity (Equation VII), Cid , to the circularity obtained by measuring the real formed pore, Cre, the inverse measured circularity value is implemented. Therefore, the printability equation is expressed as follows:
According to the printability results derived from the formula (Equation VIII), the printed structure can be classified based on the value of Pr. If Pr < 1, the structure is characterized by a rounder and smaller shape. This outcome reflects a deviation from the square geometry, where the printed material may spread more than intended, either due to material merging or the collapse of the first printed layer caused by over-extrusion during printing (Figure 1D, I). Conversely, when Pr > 1, the printed structure exhibits an irregular and bigger shape. In this scenario, the pore shape deviates significantly from the intended square, often appearing distorted or elongated, which is generally observed in an under-extrusion state (Figure 1D, II). Finally, when Pr = 1, the structure is identified as a perfect square. This classification indicates that the pore shape has been reproduced with an ideal level of accuracy, closely matching the intended geometry. Such a result suggests that the initial printed layer maintains its original shape and remains almost undeformed, even with the additional weight from a second layer applied on top (Figure 1D, III).
To evaluate pore dimensions, an initial image of the 3D-printed multilayer construct is captured (Figure 3A, I) and subsequently cropped to match the dimensions of the well plate (Figure 3A, II). The cropped image is then processed to produce a binarized pore mask, following the methodology detailed in Section 2.6 (Figure 3A, 111) . A custom Python script is then executed to analyze the processed image by applying a contour detection algorithm and measuring the distance between its points (Figure 3A, IV).

Figure 3. Printability test analysis. (A) 3D multilayer image capturing and pore analysis steps: (A, I) 3D multilayer image sampling, (A, II) image cropping and unit scale capturing, (A, III) binarized 3D multilayer image mask (red box indicates the selected pore for pore printability analysis [B]), and (A, IV) pore measurement calculation by delimitating its perimeter. (B) Pore image analysis detailed: (B, I) binarized pore mask definition, (B, II) small detail selection from the pore mask image, (B, III) contour approximation by retaining the endpoints, (B, IV) successive endpoints identification, (B, V) Euclidean distance calculation between two consecutive points, and (B, VI) pore perimeter resulting from measuring all the endpoint distances.
To quantitatively analyze the pore geometry, a binarized pore mask is defined as PBi ⊂ ℝ2 where the pore region is well-defined against the background (Figure 3B, I). This mask is created within a total set of pixel coordinates I, with (i, j) representing the row and column indices of each pixel in that set. The total pore surface S is determined by summing the pore pixels defined in the pore mask, as follows:
To determine the pore perimeter, a border-following algorithm is implemented.58 This method first identifies and classifies all boundaries and subsequently focuses on tracing the external contours of the image. In this case, the contour approximation is performed by compressing the horizontal, vertical, and diagonal segments and retaining only their endpoints (Figure 3B, II and III). The perimeter is then computed by summing the Euclidean distances between each pair of successive points on this closed contour. Considering the points in a closed contour {p0,p1,..., pn–1}, where pi = (xi,yi) (Figure 3B, IV), the Euclidean distance between two consecutive points pi and pi+1 is given by:
In summary, the perimeter P is calculated by applying the Euclidean distance formula (Equation X) to all the endpoints obtained from the closed contour (Figure 3B, V and VI). This calculation is performed using the following expression:
Essentially, the analysis process begins with image acquisition (Section 2.6; Figure 3A, I), where the captured multilayer structure image is cropped to well plate dimensions (Section 2.6; Figure 3A, II) and subsequently converted into a binary mask to isolate the pore from the filament (Section 2.6; Figure 3A, III). Following this, the pore surface is obtained by summing all the pixels from the pore mask (Equation IX). After obtaining the pore surface area, the next step involves perimeter estimation. A borderfollowing algorithm is applied to identify and classify the contours of the pore region, simplifying the contour to the key endpoints of the perimeter (Figure 3B, II and III). Then, the Euclidean distance between each successive point is calculated (Figure 3B, V; Equation X), determining the pore perimeter computation by the sum of all Euclidean distances between consecutive points in the closed-loop contour (Figure 3B, VI; Equation XI). This quantitative image analysis facilitates accurate pore measurements, providing both the total surface area and the perimeter of the pores. Obtaining all necessary parameters to calculate each pore’s printability value enables a comprehensive print quality evaluation.
2.6. Image capturing tool and image analysis
Assessing image capture for printing quality analysis is one of the key components of the protocol. Conventional microscopes, in biomedical fields, are mainly focused on microscale observation and capturing. While some can offer image-stitching techniques for recreating larger- scale images, capturing macroscale images is time- and resource-consuming.
Therefore, a different approach for capturing images of the bioprinted constructs is proposed. A USB microscope (Bysameyee, China), commonly used in the electronic soldering field, was used for capturing the image of bioprinted test constructs in this study. The USB microscope is mounted on a custom-designed 3D-printed support that allows precise control along three axes. This setup integrates three stepper motors for dimensional manipulation, providing accurate positioning and focus adjustment. Additionally, the system incorporates direct illumination of the lens using LED lights combined with custom light diffusion filters, ensuring consistent and high-quality lighting for imaging the bioprinted samples (Figure S1; Video S1, Supporting Information).
Once sample imaging was completed, the captured images were analyzed using a custom Python code developed for precise post-processing (Sections 2.4 and 2.5). The workflow was initiated by importing the image data into the code environment (Figures 2A and 3A, I and II). The imported image was then converted to grayscale to simplify the analysis by reducing computational complexity while retaining critical structural information.
To ensure accurate measurements, the image was subjected to a scaling process, where a known distance reference, such as the well plate diameter, was used to calibrate pixel-to-real-world unit conversion. This step is essential for maintaining consistency in quantifying dimensions, such as pore size and filament width. Following scaling, the image was filtered to enhance hydrogel features and minimize noise. The filtering process includes a bilateral filter, which preserves edges while reducing unwanted noise, and adaptive thresholding, which dynamically adjusts thresholds to segment regions of interest, even in varying lighting conditions.
Once the filtering step was complete, the image proceeded to the analysis stage, where two key evaluations were performed: filament analysis and pore analysis. Filament analysis evaluates the dimensions, alignment, and continuity of filaments accuracy (Figure 2A, III and IV), while pore analysis focuses on detecting, measuring, and characterizing pores within the sample, such as their shape, size, and distribution (Figure 3A, III and IV).
Finally, the analyzed results were exported into a format suitable for further examination or documentation, providing a comprehensive dataset that reflects the structural quality of the sample. This systematic approach enables precise quantification of printing outcomes and supports the optimization of printing parameters for improved structural fidelity. It allows for rapid image capture and analysis within a few minutes after the printing session, thereby facilitating the bioprinting workflow and standardizing the process.
2.7. Statistical analysis
The experiments were conducted with a sample size of n = 6 for the extrudability test and n = 3 for the deposition and printability tests. Statistical analyses were performed using R Studio (Version 2024.12.0, Build 467) and R (Version 4.4.1, 2024-06-14).
Initially, the normality of the data was assessed using the Shapiro-Wilk test to determine whether the data followed a normal distribution. For data that met the normality assumption, a one-way analysis of variance (ANOVA) was performed, followed by Tukey’s Honest Significant Difference (HSD) test for post-hoc pairwise comparisons. In cases where the data did not follow a normal distribution, the non-parametric Kruskal–Wallis test was conducted, followed by Dunn’s test with Bonferroni correction to control for multiple comparisons.
All statistical tests were conducted at a significance level of α = 0.05. The results are presented as the mean ± standard deviation. Statistical significance was indicated using the following notation: *p < 0.05, **p < 0.01, and ***p < 0.001. If no notation is displayed, the differences are not statistically significant.
3. Results and discussion
3.1. Extrudability test
After printing the solution from the extrudability test and being photo-crosslinked via UV light to facilitate easier handling of the hydrogel, its weight was measured under each printing pressure condition. Subsequently, the mass deposition rate was calculated by dividing the weight of the deposited solution by the printing time (Figure 4A). The extrudability test results were analyzed and categorized into three printing pressure ranges: low (65–70 kPa), medium (75–80 kPa), and high pressure (85–100 kPa).

Figure 4. Hydrogel samples according to the following tests: (A) extrudability, (B) deposition, and (C) printability.
In the low-pressure range, no extrusion was observed at pressures below 65 kPa (Figure 4A). This indicates that the applied pressure was insufficient to overcome the yield stress of the hydrogel solution, preventing flow through the nozzle tip. Furthermore, within this range, the mass flow rate remained relatively low and exhibited minimal variations with increasing pressure, suggesting limited practical utility due to a non-optimal flow regime.
In the medium-pressure range, the mass flow increased steadily without any indications of over-extrusion. Results within this range suggest that these printing conditions are efficient, as the error bars remained moderate, demonstrating good consistency in extrusion performance (Figure 5A). These findings indicate that this pressure range represents optimal working conditions for bioprinting, balancing material flow rate with deposition consistency.

Figure 5. Bioprinting test results. (A) Extrudability test: hydrogel mass flow (mg/s) extruded per printing pressure (kPa). (B) Deposition test: filament surface area (mm2) per printing pressure (kPa) and printing speed (mm/min) plotted against theoretical filament surface (DThS). (C) Deposition test: filament diameter (mm) per printing pressure (kPa) and printing speed (mm/min) plotted against theoretical filament diameter (DThD). (D) Printability test: pore surface (mm2) per printing parameter combination (kPa; mm/min) plotted against theoretical pore surface (PThS). (E) Printability test: printability value (-) per printing parameter combination (kPa; mm/min) plotted against theoretical printability value (PThP). All statistical tests were conducted at a significance level of α = 0.05. The results (n = 6 for extrudability, n = 3 for deposition and printability) are presented as the mean ± standard deviation. Statistical significance was indicated using the following notation: *p < 0.05, **p < 0.01, and ***p < 0.001. If no notation is displayed, the differences were not statistically significant.
In the high-pressure range, a sharp rise in mass flow rate was observed, particularly between 85 and 90 kPa (Figure 5A). This range marks a critical threshold where extrusion becomes unstable due to over-extrusion conditions, as indicated by the increase in error bars. Excessive material deposition associated with this pressure range can compromise the quality and precision of bioprinted constructs.
Statistical analysis indicated highly significant differences (p < 0.001) when comparing high-pressure conditions to lower-pressure values, specifically 100–70, 100–65, and 95–65 kPa (Figure 5A). Significant differences (p < 0.01) were also observed between high pressure and lower pressure conditions for 95–70 and 90–65 kPa, while a marginally significant difference (p < 0.05) was noted for high pressure compared to intermediate pressure at 100– 75 kPa (Figure 5A). These findings suggest that pressures exceeding 80 kPa may introduce greater variability compared to lower pressures, potentially indicating process instability at elevated printing pressure ranges.
The minimum yield stress required to initiate flow in the hydrogel solution corresponds to a printing pressure of 65 kPa. Increasing the printing pressure enhances the deposition rate, with the pressure range of 70–80 kPa identified as optimal for extrusion. Statistical analysis further confirms that pressures above 80 kPa exhibit significantly greater variability compared to lower pressures (Figure 5A). This range provides a balance between material flow rate and consistent deposition performance. However, at pressures exceeding 85 kPa, over-extrusion becomes evident, leading to excessive material deposition that negatively impacts the quality of bioprinted structures. These findings are consistent with previous studies,23,35,59 which indicate that while increased printing pressure enhances flow rate, it also induces potential instability at higher levels.
3.2. Deposition test
The extrudability test results (Figure 5A) indicate that a mass flow of 10 mg/s or less (60–80 kPa) is sufficient to ensure a consistent extrusion flow. Therefore, for the deposition test, the following printing pressure values were selected: 70, 75, and 80 kPa. The pressure value of 65 kPa was excluded, as it resulted in a rate below 1 mg/s, leading to a non-extrusion state in some cases, making it unsustainable for bioprinting extrusion.
The deposition test evaluates two parameters in relation to the theoretical structure design: the structure’s surface area and the filament diameter. These parameters were measured and analyzed to assess the deposition quality under the corresponding combinations of printing parameters: 70, 75, and 80 kPa with 300, 600, and 900 mm/ min (Figure 4B).
The experimental results reveal a strong correlation between printing parameters and filament quality (Figure 5B and C). Notably, printing pressure exhibited a highly significant effect on the surface area (p < 0.001) (Figure 5B). Each incremental increase in pressure led to a corresponding rise in filament surface area (p < 0.001) (Figure 5B), which can be attributed to greater material flow through the nozzle, as confirmed by the extrudability test (Figure 4A). Although printing speed also significantly affected surface area (p < 0.001), its impact was less pronounced compared to pressure (Figure 5B). Specifically, lower printing speeds produced larger surface areas, but the most substantial difference emerged when comparing the lowest (300 mm/min) and highest (900 mm/min) speeds (p < 0.01) (Figure 5B). Moderate speed changes did not produce notable effects, thereby emphasizing the primary role of pressure in determining surface area. Moreover, at higher speeds, variability increased, as evidenced by larger error bars (Figure 5B). Previous studies have similarly noted that lower speeds tend to produce more variability.60 This variability may be associated with filament detachment and dragging, particularly along curved pathways (Figure 4B). At 70 kPa, the measured surface area closely approximated the theoretical value (DThS) (Figure 5B). Under high-speed conditions, however, portions of the filament were occasionally missing, likely because faster nozzle movement deposited less material per unit length (Figure 4B), leading to inconsistencies in the final printed structure.
Analysis of multiple printing parameter combinations revealed that the most significant differences (p < 0.001) were observed when transitioning from low to high pressure at a given printing speed (Figure 5B); this was only observed for significant plots sharing the same parameter. Figure S2, Supporting Information, displays the complete significance. Filament diameter analysis corroborated these findings. Increasing printing pressure from 70 to 80 kPa significantly increases the filament diameter (p < 0.001), deviating from the theoretical diameter (DThD) due to higher extrusion flow (Figure 5C). Elevated pressures also generated larger error bars, reflecting greater variability in diameter (Figure 5C). For instance, at 80 kPa, some samples displayed over-extrusion, causing adjacent filaments to merge and producing notably larger diameters (Figure 4B). Although reducing the printing speed led to increased filament diameters by allowing more material deposition (Figure 4B), these effects were modest and not statistically significant (p > 0.05). These outcomes align with previous findings that lower speeds and higher pressures both contribute to larger filament diameters.60 Only specific combinations—low pressure (70 kPa) with moderate-to-high speeds (600–900 mm/min) versus high pressure (80 kPa) with low speeds (300 mm/min)— exhibited significant differences (p < 0.05) (Figure 5C). Compared with surface area findings, these results indicate that high-speed dragging induces a smaller influence on filament diameter than the over-extrusion associated with high pressures (Figure 5B and C).
Overall, these findings highlight the importance of balancing printing parameters to attain the desired filament geometry. Lower printing speeds combined with higher pressures significantly increase both surface area and filament diameter (p < 0.001), whereas higher speeds combined with lower pressures yield smaller surface areas and thinner filaments (Figure 4B). These results concur with previous studies,39,61 which have demonstrated a clear correlation between pressure and filament width: higher pressure produces wider filaments, while lower pressure produces narrower ones. Likewise, slower speeds result in wider filaments, whereas faster speeds result in thinner filaments.
The results demonstrate that optimal outcomes were achieved with specific combinations of pressure and printing speed, including low pressure and low speed (70 kPa and 300 mm/min), high pressure and high speed (80 kPa and 900 mm/min), and intermediate conditions (75 kPa and 600 mm/min) (Figure 4B). Among these, the combination of 70 kPa and 300 mm/min produced the most accurate surface and diameter values relative to the theoretical values. Furthermore, this condition exhibited superior consistency, as evidenced by smaller error bars compared to the other combinations (Figure 5B and C).
3.3. Printability test
The deposition test identified a range of printing parameters capable of producing high-quality hydrogel filaments (Figure 4B). Optimal combinations included low pressure at low speed (70 kPa and 300 mm/min), high pressure at high speed (80 kPa and 900 mm/min), and intermediate parameter values (75 kPa and 600 mm/min). Among these, the combination of 70 kPa and 300 mm/min emerged as the most promising with values close to the theoretical (DThS and DThD) (Figure 5B and C). However, further investigation is warranted to confirm optimal printing conditions, as the current analysis provides only a 2D perspective and does not account for the ability to fabricate more complex 3D structures.
To further analyze these parameter combinations, a printability test was conducted on two-layer constructs, selecting 16 inner pores for evaluation to avoid undesired values caused by inconsistencies in the nozzle-traveling curve paths. An examination of the pore surface area reveals that, for all parameter combinations, the measured surface areas are consistently lower than the theoretical value (PThS) (Figure 5D). This outcome indicates that the hydrogel solution spreads upon contact with the substrate or the current layer, leading to smaller pore dimensions.
These observations align with the results from the previous deposition test, where the measured surface and diameter values exceeded the theoretical values (DThS and DThD) (Figure 5B and C). This increase in filament dimensions relative to theoretical expectations is well documented in the literature.32,55,62 This deviation is primarily attributed to the viscoelastic properties of hydrogels, particularly the Barus effect. This effect may explain that during the extrusion process, as the solution flows through the nozzle, it experiences confinement, leading to stress and stretching of polymer chains. Upon exiting the nozzle outlet, the solution expands due to the elastic recovery of the polymer chains and their partial relaxation, increasing the extruded diameter.63 Usually to mitigate his effect, printing parameters—such as pressure and speed—can be optimized as described in the deposition test (Figure 4B).
Under low printing pressure and speed (70 kPa and 300 mm/min), a larger pore surface area was observed, likely due to under-extrusion and filament dragging (Figure 5D). This effect, previously reported in the literature,59 suggests that at lower pressures, the extruded filament requires more time to reach a desired length, leading to deposition in midair. Consequently, during a dynamic printing process, the filament drags until it extends sufficiently to make contact, resulting in deformed or misplaced structures (Figure 4C).
Conversely, high printing pressure and speed (80 kPa and 900 mm/min) resulted in smaller pore areas, attributed to over-extrusion and filament merging (Figure 5D). According to the literature,32 higher pressure values increase material deposition, causing excessive spreading of the hydrogel on the substrate. This leads to a deviation from the theoretical layer height, where excess material fills available spaces and transforms sharp corners into rounded angles within the original structure design (Figure 4C).
This layer height variation relative to the constant nozzle height can significantly impact bioprinting quality.60 Under optimal extrusion conditions (Figure 6A), the extruded filament contacts the previously printed layer at a controlled height (HI), allowing the filament to expand because of its viscoelastic properties (Figure 6A, I). As the nozzle moves, the filament is deposited without external interferences (Figure 6A, II), leading to high shape fidelity in the printed model (Figure 6A, III). In contrast, overextrusion (Figure 6B) results in greater substrate height (Ho) than the intended value (HI), causing the extruded filament to reach the substrate more quickly (Figure 6B, I). As the contact point occurs at a higher position (yo > yI ), the deposition location is delayed (xo < xI), forcing the material into a space that is already occupied (Figure 6B, II). As a result, the extruded solution is compressed by the nozzle tip, leading to material spreading and producing swollen, deformed structures (Figure 6B, III). Additionally, this increased substrate height reduces the intra-segment distance (Lo) relative to the optimal one (LI), thereby increasing contact between adjacent filaments and resulting in smaller pores in the final printed structure (Figure 6B, III). Conversely, under-extrusion (Figure 6C) leads to a lower substrate height (HU) than intended, prolonging the time required for the extruded filament to contact the previous layer (Figure 6C, I). The increased gap between the nozzle and the deposition point (yU < yI) suggests that the filament is initially extruded in midair before contacting the substrate, causing the contact point to be moved forward (xU > xI) (Figure 6C, I). This position shift can lead to filament deformation and misalignment (Figure 6C, II), which may compromise the structural integrity of the print due to dragging effects and a reduced contact surface that would otherwise stabilize the newly deposited filament. Consequently, larger pores may appear in the final printability structure due to thinner and displaced filaments (Figure 6C, III).

Figure 6. Substrate height difference effect according to constant nozzle height: (A) ideal optimal extrusion, (B) over-extrusion, and (C) under-extrusion. (I) Filament contact point position (red mark) (Pi = (xi , yi)) to the previous filament layer, including the intra-segment distance (Li) and the filament height (Hi). (II) Filament shape during the extrusion process. (III) Final printability model according to filament height differences.
Analysis of the pore surface error bars revealed significant variability under both low printing conditions (70 kPa and 300 mm/min) and high printing conditions (80 kPa and 900 mm/min), with a high statistical significance (p < 0.001) (Figure 5D). In contrast, the intermediate printing conditions (75 kPa and 600 mm/ min) demonstrated a more stable and consistent printing process (Figure 5D). Furthermore, a significant difference (p < 0.001) was observed between the intermediate- and high-printing conditions, suggesting that higher printing speeds and pressures may introduce instability during the bioprinting process (Figure 5D).
Regarding pore printability, all printing parameter combinations produced pores that closely matched the theoretical value (PThP) (Figure 5E). This resulted in pores with a nearly square shape, indicating strong filament structural integrity and enough stiffness to hold the hydrogel weight and not merge (Figure 4C). When examining variability—consistent with the previous pore surface analysis—the intermediate pressure and speed conditions (75 kPa and 600 mm/min) again demonstrated better consistency, reflected in more reproducible outcomes for the final printed constructs (Figure 5D and E).
These findings underscore the importance of performing a dedicated test for 3D shape fidelity. Based solely on the initial deposition test (Figure 5B and C), the optimal printing parameters appeared to be 70 kPa and 300 mm/min; however, the subsequent evaluation revealed that 75 kPa and 600 mm/min displayed better results. This final test provided additional insights into overall 3D bioprinting quality, particularly highlighting the influence of layer height differences between the deposited layers (Figure 6).
4. Conclusion
Bioprinting has emerged as a transformative technology in tissue engineering, allowing the fabrication of highly customized cell-laden constructs.64 Among the different bioprinting methods, extrusion-based approach stands out for its versatility and relatively straightforward setup.65 However, achieving high-quality, reproducible printings requires optimizing multiple printing parameters—such as printing pressure, nozzle type, and printing speed—which can result in significant trial and error experimentation. These iterative adjustments pose a significant concern when high-cost bio-based hydrogel components or scarce cell lines are incorporated into the biomaterial ink formulation, requiring careful optimization to minimize waste and depletion of resources.
To streamline the bioprinting characterization process, a range of personalized software and hardware tools have been developed for future researchers. First, a userfriendly application facilitates the generation of G-code files to perform various bioprinting quality tests, while also allowing custom parameter adjustments through an intuitive interface (Figure S3, Supporting Information). After the tests have been performed, the resulting prints are documented using a custom-designed lens-support system that enables rapid, high-resolution image capture. Subsequently, a purpose-built software application automates the quantification and analysis of these images, further enhancing both the efficiency and accuracy of the characterization process.
The proposed working framework outlines a clear strategy for print optimization through three distinct tests. First, the extrudability test (Figure 1B) identifies an appropriate pressure range to achieve consistent solution extrusion. Next, the deposition test (Figure 1C) determines suitable combinations of printing pressure and speed for producing high-quality printed filaments. Finally, the printability test (Figure 1D) evaluates the ability to handle complex, multi-layered structures, ensuring a robust performance in more intricate constructs while identifying issues, such as dragging or merging effects.
According to previous printing quality tests, the proposed biomaterial ink exhibits a non-Newtonian, shearthinning behavior with a specific yield stress of 65 kPa. Increasing printing pressure improved extrusion flow, with an optimum pressure range from 70 to 80 kPa (Figure 4A). A deeper printing analysis indicated that the best filament quality can be achieved either with a pressure of 70 kPa and a printing speed of 300 mm/min, at 75 kPa and 600 mm/ min, or at 80 kPa and 900 mm/min (Figure 4B). Among these, the combination of 75 kPa and 600 mm/min was identified as the most suitable condition for achieving high 3D shape fidelity in more complex constructs (Figure 4C).
The complex rheological behavior of biomaterial inks plays a fundamental role in bioprinting performance, influencing extrusion dynamics, shape fidelity, and ultimately, cell viability. Rheological properties, such as viscosity, shear-thinning behavior, yield stress, and thixotropy, dictate the biomaterial ink’s ability to flow under applied stress and recover structural integrity post- extrusion.66 While detailed rheological assessments can provide critical insights into biomaterial ink formulation and process optimization, they often introduce additional complexity, particularly due to the high sensitivity of rheological properties to the ink composition, temperature, and crosslinking kinetics. In our study, we prioritized a direct, application-driven evaluation of printing outcomes, ensuring broad applicability across different biomaterial ink formulations and experimental setups. However, it is well established that nozzle parameters—such as nozzle type and outlet diameter—are known to critically affect velocity profiles and induce critical fluid shear stresses.67,68 Finite element simulations can offer valuable insights into these fluid dynamics, enabling quantitative assessment of shear stress and its subsequent impact on cell viability.69 Moving forward, it will be essential to integrate cell viability assays into bioprinting trials to directly correlate viability outcomes with shear stress under varying printing parameters. This combined approach will enhance and complete the bioprinting characterization and guide the design of robust, cell-friendly printing strategies.
Furthermore, while the current study focuses on square pores for consistency and reproducibility, future implementations could incorporate shape factor analysis or morphometric measurements to quantify deviations from the intended pore geometry. The adaptability of our computational framework ensures that printability assessments remain robust across different scaffold architectures and bioprinting conditions. This highlights a key advantage of our approach, as it provides a structured yet flexible methodology that can be expanded to accommodate more complex geometries and structural analyses. Another limitation of our current setup is the topview imaging system, which restricts direct measurements of Z-collapse. While our experimental observations remain consistent with expected extrusion-based deformations, as described previously (Figure 6), future adaptions of our methodology could incorporate side-view imaging or 3D profilometry to directly quantify layer height variations and material collapse in the vertical direction.
Beyond classical tissue engineering applications, the proposed framework also holds potential for adaption to emerging areas of extrusion-based bioprinting, such as plant cell bioprinting and cultured meat production. In plant cell bioprinting, recent studies have highlighted the importance of developing biomaterial inks that balance high shape fidelity with biocompatibility.70 These systems commonly use shear-thinning and yield stress biopolymers and face challenges like those addressed by the proposed workflow, particularly in optimizing extrusion parameters and assessing print fidelity. Likewise, in cultured meat bioprinting, extrusion-based techniques are frequently employed, often in conjunction with support bath systems to facilitate crosslinking and structural alignment.71 While these bath-based approaches modify certain printing dynamics, key parameters, such as extrusion consistency and filament fidelity, remain central to evaluating construct quality. Notably, some studies have applied quantitative assessments, such as pore size measurements, to evaluate printability even in these embedded systems.72,73 In this context, the methodology presented in this study, including the camera setup and image-based analysis tools, offers a flexible platform that could be adapted to support both fields. Incorporating such a standardized approach could contribute to greater reproducibility and optimization in these rapidly advancing areas of bioprinting.
Overall, the proposed working framework optimizes the 3D bioprinting process by minimizing material waste, reducing the total number of tests to three, and providing a clear straightforward method for determining ideal printing parameters. This establishes a robust framework for assessing printing quality and lays a solid foundation for advancing 3D bioprinting, leading to more consistent and precise tissue engineering applications.
1.Halper J. Narrative review and guide: state of the art and emerging opportunities of bioprinting in tissue regeneration and medical instrumentation. Bioengineering. 2025;12(1):71.
doi: 10.3390/bioengineering12010071
2.Wilson WC, Boland T. Cell and organ printing 1: Protein and cell printers. Anat Rec A Discov Mol Cell Evol Biol. 2003;272(2):491-496.
doi: 10.1002/ar.a.10057
3.Matai I, Kaur G, Seyedsalehi A, McClinton A, Laurencin CT. Progress in 3D bioprinting technology for tissue/organ regenerative engineering. Biomaterials. 2020;226:119536.
doi: 10.1016/j.biomaterials.2019.119536
4.Noor N, Shapira A, Edri R, Gal I, Wertheim L, Dvir T. 3D printing of personalized thick and perfusable cardiac patches and hearts. Adv Sci. 2019;6(11):1900344.
5.Gao G, Ahn M, Cho WW, Kim BS, Cho DW. 3D printing of pharmaceutical application: drug screening and drug delivery. Pharmaceutics. 2021;13(9):1373.
doi: 10.3390/pharmaceutics13091373
6.Sousa AC, Alvites R, Lopes B, et al. Three-dimensional printing/bioprinting and cellular therapies for regenerative medicine: current advances. J Funct Biomater. 2025; 16(1):28.
doi: 10.3390/jfb16010028
7.Zimmerling A, Chen X. Bioprinting for combating infectious diseases. Bioprinting. 2020;20:e00104.
doi: 10.1016/j.bprint.2020.e00104
8.Kantaros A, Ganetsos T, Petrescu FIT, Alysandratou E. Bioprinting and intellectual property: challenges, opportunities, and the road ahead. Bioengineering. 2025;12(1):76.
doi: 10.3390/bioengineering12010076
9.Kinjoll Dey. 3D Bioprinting Market Size, Share & Trends Analysis Report by Technology (Magnetic Levitation, Inkjet-Based), By Application (Medical, Dental, Biosensors, Bioinks), By Region, And Segment Forecasts, 2023 - 2030; 2024.
https://www.grandviewresearch.com/horizon/outlook/3d-bioprinting-
10.Vanaei S, Parizi MS, Vanaei S, Salemizadehparizi F, Vanaei HR. An overview on materials and techniques in 3D bioprinting toward biomedical application. Engin Regenerat. 2021;2:1-18.
doi: 10.1016/j.engreg.2020.12.001
11.Skardal A. Perspective: “Universal” bioink technology for advancing extrusion bioprinting-based biomanufacturing. Bioprinting. 2018;10:e00026.
doi: 10.1016/j.bprint.2018.e00026
12.Gungor-Ozkerim PS, Inci I, Zhang YS, Khademhosseini A, Dokmeci MR. Bioinks for 3D bioprinting: an overview. Biomater Sci. 2018;6(5):915-946.
doi: 10.1039/c7bm00765e
13.Mathur V, Agarwal P, Kasturi M, Srinivasan V, Seetharam RN, Vasanthan KS. Innovative bioinks for 3D bioprinting: Exploring technological potential and regulatory challenges. J Tissue Eng. 2025;16: 20417314241308022.
doi: 10.1177/20417314241308022
14.Vijayavenkataraman S. 3D bioprinting: challenges in commercialization and clinical translation. J 3D Print Med. 2023;7(3).
15.Simon A, Grohens Y, Vandanjon L, Bourseau P, Balnois E, Levesque G. A comparative study of the rheological and structural properties of gelatin gels of mammalian and fish origins. In: Macromolecular Symposia, Vol. 203; 2003:331-338.
16.Michelini L, Probo L, Farè S, Contessi Negrini N. Characterization of gelatin hydrogels derived from different animal sources. Mater Lett. 2020;272;127865.
doi: 10.1016/j.matlet.2020.127865
17.Sompie M, Triatmojo S, Pertiwiningrum A, Pranoto Y. The effects of animal age and acetic acid concentration on pigskin gelatin characteristics. J Indones Trop Anim Agric. 2012;37(3):176-182.
doi: 10.14710/jitaa.37.3.176-182
18.Netter AB, Goudoulas TB, Germann N. Effects of Bloom number on phase transition of gelatin determined by means of rheological characterization. LWT. 2020;132:109813.
doi: 10.1016/j.lwt.2020.109813
19.Gaglio CG, Baruffaldi D, Pirri CF, Napione L, Frascella F. GelMA synthesis and sources comparison for 3D multimaterial bioprinting. Front Bioeng Biotechnol. 2024;12:1383010.
doi: 10.3389/fbioe.2024.1383010
20.Standard Guide for Bioinks Used in Bioprinting; 2024.
doi: 10.1520/F3659-24
21.Standards Coordinating Body. Project: Specifications for Bioinks and Bioprinters. Accessed November 25, 2024. https://www.standardscoordinatingbody.org/project- specification-printability-bioink
22.Schwab A, Levato R, D’Este M, Piluso S, Eglin D, Malda J. Printability and Shape Fidelity of Bioinks in 3D Bioprinting. Chem Rev. 2020;120(19):11028-11055.
doi: 10.1021/acs.chemrev.0c00084
23.Paxton N, Smolan W, Böck T, Melchels F, Groll J, Jungst T. Proposal to assess printability of bioinks for extrusionbased bioprinting and evaluation of rheological properties governing bioprintability. Biofabrication. 2017;9(4):044107.
24.Gao T, Gillispie GJ, Copus JS, et al. Optimization of gelatin- alginate composite bioink printability using rheological parameters: a systematic approach. Biofabrication. 2018;10(3):034106.
25.Ribeiro A, Blokzijl MM, Levato R, et al. Assessing bioink shape fidelity to aid material development in 3D bioprinting. Biofabrication. 2018;10(1):014102.
26.Therriault D, White SR, Lewis JA. Rheological behavior of fugitive organic inks for direct-write assembly. Appl Rheol. 2007;17(1):10112-1–10112-8.
27.Ouyang L, Yao R, Zhao Y, Sun W. Effect of bioink properties on printability and cell viability for 3D bioplotting of embryonic stem cells. Biofabrication. 2016;8(3):035020.
doi: 10.1088/1758-5090/8/3/035020
28.Li Z, Ramos A, Li MC, et al. Improvement of cell deposition by self-absorbent capability of freeze-dried 3D-bioprinted scaffolds derived from cellulose material-alginate hydrogels. Biomed Phys Eng Express. 2020;6(4):045009.
29.Rodríguez-Rego JM, Mendoza-Cerezo L, Macías-García A, Carrasco-Amador JP, Marcos-Romero AC. Methodology for characterizing the printability of hydrogels. Int J Bioprint. 2022;9(2):280-291.
30.Xu J, Yang S, Su Y, et al. A 3D bioprinted tumor model fabricated with gelatin/sodium alginate/decellularized extracellular matrix bioink. Int J Bioprint. 2023;9(1):109-130.
31.Esser TU, Anspach A, Muenzebrock KA, et al. Direct 3D-bioprinting of hiPSC-derived cardiomyocytes to generate functional cardiac tissues. Adv Mater. 2023;35(52): e2305911.
32.Perin F, Spessot E, Famà A, et al. Modeling a dynamic printability window on polysaccharide blend inks for extrusion bioprinting. ACS Biomater Sci Eng. 2023;9(3):1320-1331.
doi: 10.1021/acsbiomaterials.2c01143
33.Bonatti AF, Chiesa I, Vozzi G, De Maria C. Open-source CAD-CAM simulator of the extrusion-based bioprinting process. Bioprinting. 2021;24:e00156.
doi: 10.1016/j.bprint.2021.e00172
34.Galocha-León C, Antich C, Voltes-Martínez A, et al. Human mesenchymal stromal cells-laden crosslinked hyaluronic acid-alginate bioink for 3D bioprinting applications in tissue engineering. Drug Deliv Transl Res. 2025;15(1):291-311.
doi: 10.1007/s13346-024-01596-9
35.O’Connell C, Ren J, Pope L, et al. Characterizing bioinks for extrusion bioprinting: printability and rheology. In: Methods in Molecular Biology. Vol. 2140. Humana Press Inc.; 2020:111-133.
doi: 10.1007/978-1-0716-0520-2_7
36.Ruberu K, Senadeera M, Rana S, et al. Coupling machine learning with 3D bioprinting to fast track optimisation of extrusion printing. Appl Mater Today. 2021;22:100914.
doi: 10.1016/j.apmt.2020.100914
37.Lai Y, Xiao X, Huang Z, et al. Photocrosslinkable biomaterials for 3D bioprinting: mechanisms, recent advances, and future prospects. Int J Mol Sci. 2024;25(23):12567.
38.Balaji KV, Bhutoria S, Nayak S, Anil Kumar P, Velayudhan S. Printability assessment of modified filament deposition modelling three dimensional bioprinter printer using polymeric formulations. Biomed Eng Adv. 2023;5:100083.
doi: 10.1016/j.bea.2023.100083
39.Webb B, Doyle BJ. Parameter optimization for 3D bioprinting of hydrogels. Bioprinting. 2017;8:8-12.
doi: 10.1016/j.bprint.2017.09.001
40.Yue K, Trujillo-de Santiago G, Alvarez MM, Tamayol A, Annabi N, Khademhosseini A. Synthesis, properties, and biomedical applications of gelatin methacryloyl (GelMA) hydrogels. Biomaterials. 2015;73:254-271.
doi: 10.1016/j.biomaterials.2015.08.045
41.Elkhoury K, Zuazola J, Vijayavenkataraman S. Bioprinting the future using light: a review on photocrosslinking reactions, photoreactive groups, and photoinitiators. SLAS Technol. 2023;28(3):142-151.
doi: 10.1016/j.slast.2023.02.003
42.Razi SM, Fahim H, Amirabadi S, Rashidinejad A. An overview of the functional properties of egg white proteins and their application in the food industry. Food Hydrocoll. 2023;135: 108183.
doi: 10.1016/j.foodhyd.2022.108183
43.Jalili-Firoozinezhad S, Filippi M, Mohabatpour F, Letourneur D, Scherberich A. Chicken egg white: hatching of a new old biomaterial. Mater Today. 2020;40:193-214.
doi: 10.1016/j.mattod.2020.05.022
44.Mousseau Y, Mollard S, Qiu H, et al. In vitro 3D angiogenesis assay in egg white matrix: comparison to Matrigel, compatibility to various species, and suitability for drug testing. Lab Investig. 2014;94(3):340-349.
doi: 10.1038/labinvest.2013.150
45.Mahmoodi M, Darabi MA, Mohaghegh N, et al. Egg white photocrosslinkable hydrogels as versatile bioinks for advanced tissue engineering applications. Adv Funct Mater. 2024;34(32):2315040.
46.Pele KG, Amaveda H, Mora M, et al. Hydrocolloids of egg white and gelatin as a platform for hydrogel-based tissue engineering. Gels. 2023;9(6):505.
doi: 10.3390/gels9060505
47.Van Der Plancken I, Van Loey A, Hendrickx ME. Effect of heat-treatment on the physico-chemical properties of egg white proteins: a kinetic study. J Food Eng. 2006;75(3):316-326.
doi: 10.1016/j.jfoodeng.2005.04.019
48.Stojkov G, Niyazov Z, Picchioni F, Bose RK. Relationship between structure and rheology of hydrogels for various applications. Gels. 2021;7(4):255.
doi: 10.3390/gels7040255
49.Irgens F. Rheology and Non-Newtonian Fluids. Springer International Publishing; 2014.
doi: 10.1007/978-3-319-01053-3
50.Guo R, Tang W. Optimizing printhead design for enhanced temperature control in extrusion-based bioprinting. Micromachines (Basel). 2024;15(8):943.
doi: 10.3390/mi15080943
51.Shao MH, Cui B, Zheng TF, Wang CH. Ultrasonic manipulation of cells for alleviating the clogging of extrusionbased bioprinting nozzles. J Phys Conf Ser. 2021;1798:012009.
doi: 10.1088/1742-6596/1798/1/012009
52.Xu H, Liu J, Zhang Z, Xu C. Cell sedimentation during 3D bioprinting: a mini review. Biodes Manuf. 2022; 5(3):617-626.
doi: 10.1007/s42242-022-00183-6
53.Fu Z, Naghieh S, Xu C, Wang C, Sun W, Chen X. Printability in extrusion bioprinting. Biofabrication. 2021;13(3).
54.Ren Y, Liu Z, Shum HC. Breakup dynamics and dripping-to- jetting transition in a Newtonian/shear-thinning multiphase microsystem. Lab Chip. 2015;15(1):121-134.
doi: 10.1039/c4lc00798k
55.Daly AC, Critchley SE, Rencsok EM, Kelly DJ. A comparison of different bioinks for 3D bioprinting of fibrocartilage and hyaline cartilage. Biofabrication. 2016;8(4):045002.
doi: 10.1088/1758-5090/8/4/045002
56.Hildebrand T, Rüegsegger P. A new method for the modelindependent assessment of thickness in three-dimensional images. J Microsc. 1997;185(1):67-75.
doi: 10.1046/j.1365-2818.1997.1340694.x
57.Dahl VA, Dahl AB. Fast local thickness. In: Proceedings of the IEEE/CVF Conference on Computer Vision and Pattern Recognition Workshops; 2023:4335-4343.
58.Suzuki S. Topological structural analysis of digitized binary images by border following. Comp Vis Graphics Image Process 1985;30(1):32-46.
59.Arjoca S, Bojin F, Neagu M, Păunescu A, Neagu A, Păunescu V. Hydrogel extrusion speed measurements for the optimization of bioprinting parameters. Gels. 2024;10(2):103.
doi: 10.3390/gels10020103
60.Rastin H, Zhang B, Bi J, Hassan K, Tung TT, Losic D. 3D printing of cell-laden electroconductive bioinks for tissue engineering applications. J Mater Chem B. 2020;8(27):5862-5876.
doi: 10.1039/d0tb00627k
61.Zhou K, Dey M, Ayan B, et al. Fabrication of PDMS microfluidic devices using nanoclay-reinforced Pluronic F-127 as a sacrificial ink. Biomed Mater (Bristol). 2021;16(4): 045005.
62.Freeman FE, Kelly DJ. Tuning alginate bioink stiffness and composition for controlled growth factor delivery and to spatially direct MSC fate within bioprinted tissues. Sci Rep. 2017;7(1):17042.
doi: 10.1038/s41598-017-17286-1
63.Jungst T, Smolan W, Schacht K, Scheibel T, Groll J. Strategies and molecular design criteria for 3D printable hydrogels. Chem Rev. 2016;116(3):1496-1539.
doi: 10.1021/acs.chemrev.5b00303
64.Bektas CK, Luo J, Conley B, Le KPN, Lee KB. 3D bioprinting approaches for enhancing stem cell-based neural tissue regeneration. Acta Biomater. 2025;193:20-48.
doi: 10.1016/j.actbio.2025.01.006
65.Wu CA, Zhu Y, Woo YJ. Advances in 3D bioprinting: techniques, applications, and future directions for cardiac tissue engineering. Bioengineering. 2023;10(7):842.
doi: 10.3390/bioengineering10070842
66.Bercea M. Rheology as a Tool for Fine-Tuning the Properties of Printable Bioinspired Gels. Molecules. 2023;28(6):2766.
doi: 10.3390/molecules28062766
67.Reina-Romo E, Mandal S, Amorim P, Bloemen V, Ferraris E, Geris L. Towards the experimentally-informed in silico nozzle design optimization for extrusion-based bioprinting of shear-thinning hydrogels. Front Bioeng Biotechnol. 2021;9:701778.
doi: 10.3389/fbioe.2021.701778
68.Oyinloye TM, Yoon WB. Application of computational fluid dynamics (CFD) in the deposition process and printability assessment of 3D printing using rice paste. Processes. 2022;10(1):68.
doi: 10.3390/pr10010068
69.Lucas L, Aravind A, Emma P, Christophe M, Edwin- Joffrey C. Rheology, simulation and data analysis toward bioprinting cell viability awareness. Bioprinting. 2021;21.
doi: 10.1016/j.bprint.2020.e00119
70.Landerneau S, Lemarié L, Marquette C, Petiot E. Green 3D bioprinting of plant cells: a new scope for 3D bioprinting. Bioprinting. 2022;27:e00216.
doi: 10.1016/j.bprint.2022.e00216
71.Chua CK, An J, Fan S, et al. A perspective on transformative bioprinting. Int J Bioprint. 2024;11(1):3525.
doi: 10.36922/ijb.3525
72.Lai G, Meagher L. Versatile xanthan gum-based support bath material compatible with multiple crosslinking mechanisms: rheological properties, printability, and cytocompatibility study. Biofabrication. 2024;16(3).
73.Ding H, Chang RC. Printability study of bioprinted tubular structures using liquid hydrogel precursors in a support bath. Appl Sci. 2018;8(3):403.
doi: 10.3390/app8030403