

Accuracy validation of patient-specific 3D-printed acetabular revision prostheses: A stereotactic accuracy analysis

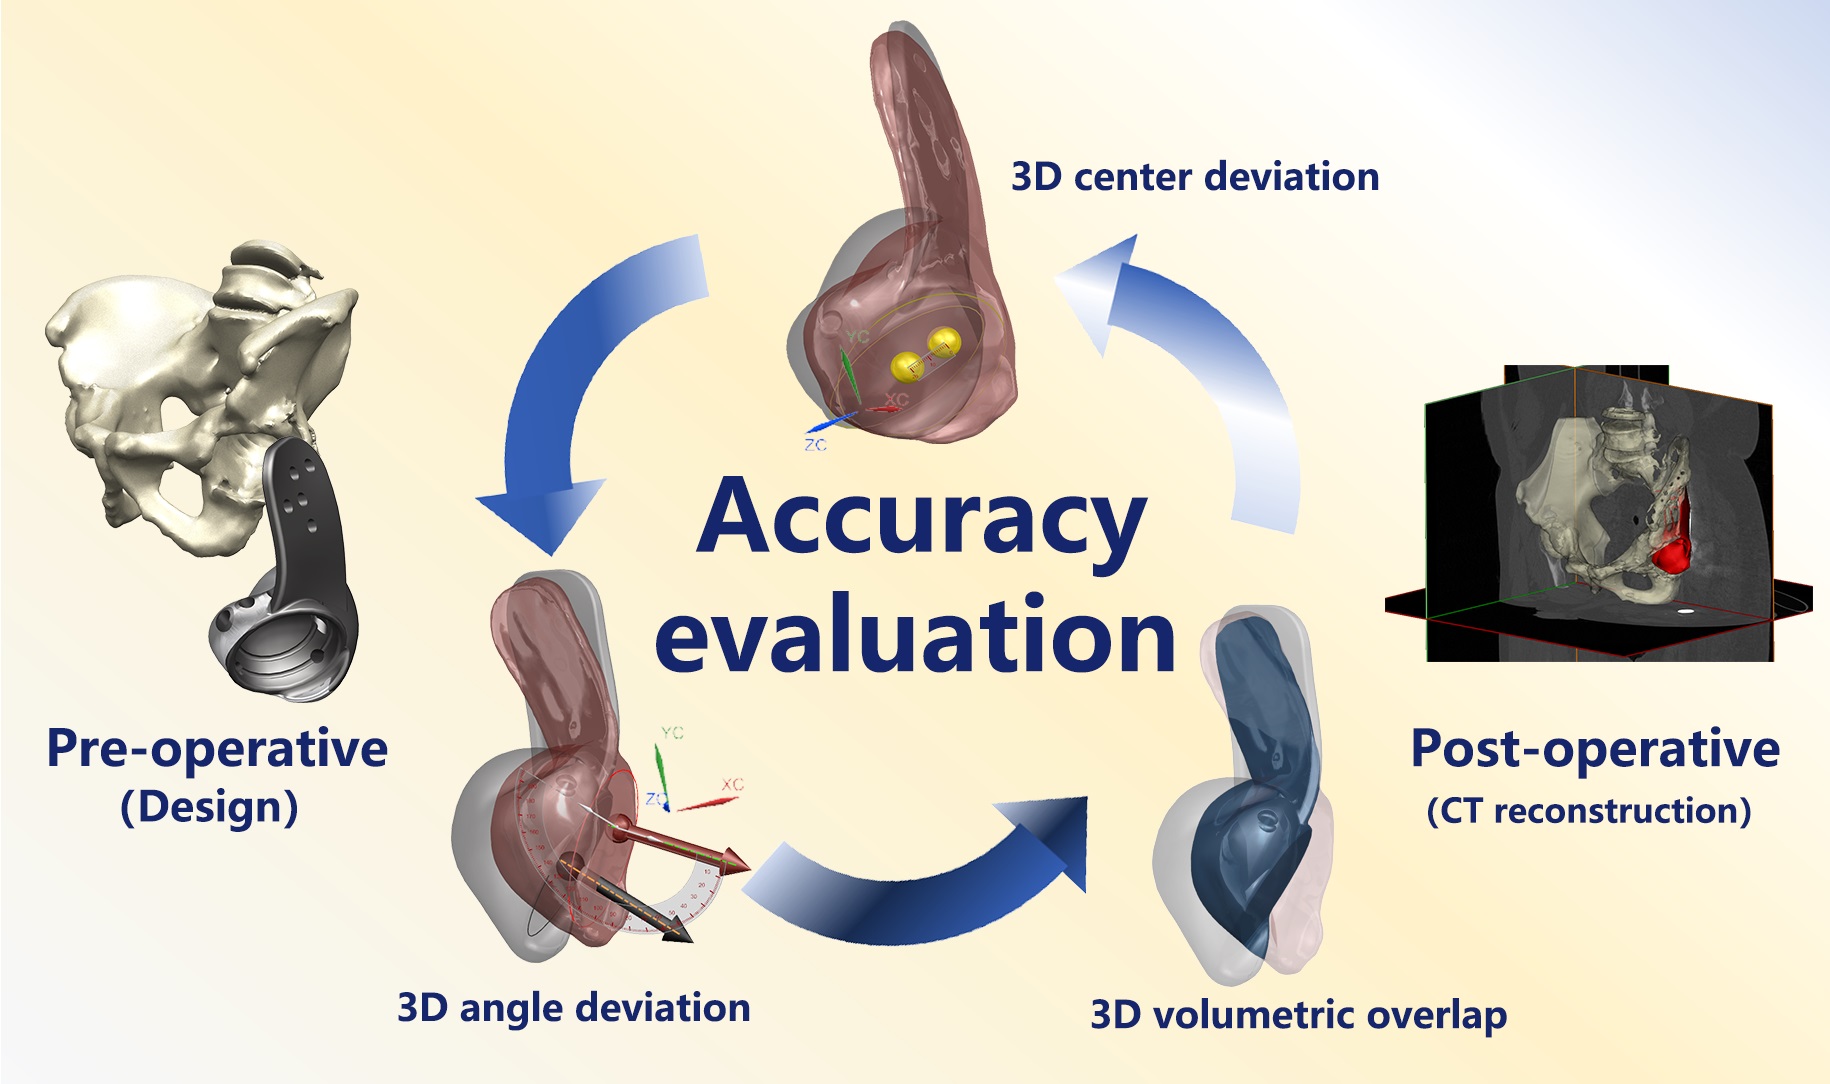
Assessing the positioning of prostheses after surgery is essential for evaluating therapeutic efficacy and optimizing surgical methods in three-dimensional (3D)-printed patient-specific acetabular revision implants. However, the lack of an effective 3D accuracy assessment framework for these customized implants has impeded the development of standardized benchmarks for verifying spatial alignment between intraoperative placement and preoperative digital planning. To bridge this gap, we introduce a novel evaluation system that integrates point localization, vector-based angular assessment, and volumetric overlap analysis to comprehensively quantify alignment between implanted prostheses and preoperative templates. Patients were classified into cohorts according to postoperative Harris Hip Scores (HHS) and complication profiles, differentiating a “better outcome” group (HHS ≥ 80, no major complications) from a “regular outcome” group. A computed tomography (CT)-based pelvic 3D coordinate system, established through anatomical landmarks, facilitated comparative analyses of intergroup variations in positional deviation, angular deviation, and volumetric overlap accuracy. The system’s reliability was confirmed via inter- and intra-observer consistency tests. Findings revealed outstanding measurement consistency (κ > 0.8). Compared to the regular outcome group, patients with better outcomes demonstrated significantly lower positional deviations (p < 0.001) and angular deviations (p = 0.003), along with superior volumetric overlap accuracy (p < 0.001). This CT-guided stereotactic assessment system offers a clinically relevant, high-fidelity approach for evaluating postoperative implant placement in 3D-printed acetabular prostheses. Notably, it represents the first validated methodology leveraging a pelvic 3D coordinate framework for a comprehensive analysis of preoperative planning versus postoperative implant positioning.
1. Introduction
Hip revision arthroplasty remains the principal intervention for managing failed prostheses, aiming to restore function and quality of life.1–5 With population aging and increased primary replacements, the revision burden has escalated significantly,6,7 with 3- and 5-year rates of 16.1% and 19.4%, respectively.8 These procedures carry substantial risks, with complication rates ≤40%9–12 and 15-year failure rates reaching 27.4%,10 highlighting the imperative for surgical optimization.13 Critical to long-term success is optimal bone-implant congruence,9 driving the clinical adoption of three-dimensional (3D)-printed patient-specific acetabular components with complex geometries.
Despite their anatomical advantages, customized prostheses lack validated 3D accuracy assessment protocols.14 Precise positioning critically influences bone-prosthesis integration, wear patterns, and biomechanical performance,15–18 necessitating reliable evaluation methods for prognostic prediction and surgical refinement.16,18–20
Conventional radiography remains prevalent for postoperative assessment,21 building upon Murray’s foundational work defining radiographic parameters.9 However, its limitations in revision scenarios are well-documented as follows: positional artifacts,22–24 anatomical overlap,25 and compromised reliability in deformed pelvises.18,26 While multi-angle projections utilize 3D approximation, the accuracy deteriorates with periacetabular pathology.18
Computed tomography (CT)-based 3D reconstruction theoretically overcomes these limitations through volumetric analysis26; however, existing protocols inadequately address custom prosthesis variability and demonstrate unverified reproducibility. Technical complexity and software dependency further hinder clinical adoption.
This study addresses the following three critical requirements for next-generation assessment systems: (i) superior accuracy to radiography, (ii) compatibility with personalized prosthesis planning, and (iii) standardized reproducibility across operators. We propose a novel CT-based stereotactic evaluation protocol that integrates anatomical coordinate systems with computational overlap analysis, establishing a validated framework for 3D-printed acetabular revision assessment.
2. Methods
2.1. Patient follow-up, imaging data collection, and grouping
Between 2014 and 2021, our institution (Shanghai Ninth People’s Hospital afflicted to Shanghai Jiao Tong University School of Medicine) conducted hip revision arthroplasties utilizing patient-specific 3D-printed acetabular components in 11 consecutive cases. Patients underwent prospective monitoring with a mean follow-up duration of 47.9 months (range: 17–98 months). Serial evaluations incorporated Harris Hip Scores (HHS) and postoperative pelvic CT imaging. Comprehensive documentation of major complications included prosthetic dislocation, revision surgery for periprosthetic fracture or infection, and neurological deficits. Cases demonstrating HHS ≥ 80 (designated “good” or superior outcomes) without major complications were classified into the “better outcome” cohort, with the remaining cases constituting the “regular outcome” group.
This study received ethical approval from the School of Medicine Institutional Review Board (Shanghai Jiao Tong University, China) and was conducted in strict adherence to the Declaration of Helsinki principles (JBJS 79A:1089-98, 1997). All private and confidential health information was managed according to HIPAA regulations (45 CFR Part 164).
2.2. Implant design and fabrication
Following preoperative pelvic CT acquisition, two senior clinicians with clinician–engineer collaborative experience performed 3D reconstruction of the patient’s pelvic anatomy and residual metallic implants using MIMICS Medical software (Materialise, Belgium). Surgical planning was meticulously discussed until consensus was achieved. The optimized bone reconstruction data, representing intraoperatively preserved residual pelvic structures, were exported in binary surface tessellation language (STL) format and imported into UG NX (Siemens, Germany) for prosthesis design.
The spatial coordinates of the affected-side rotation center were determined through mirror-imaging of the contralateral femoral head rotational center. Acetabular cup parameters included 15° anteversion, 40° abduction, 57 mm outer diameter, and 49 mm inner diameter. Patient-specific defect filling was achieved via irregular volumetric geometries precisely conforming to the residual acetabular cavity, while plate-like structures provided screw fixation anchors. Design protocols strictly prevented complete or near-complete cavity enclosures to ensure manufacturability and post-processing powder removal. To minimize the negative effects of excessive prosthesis weight on postoperative recovery, a partial filling approach was adopted for patients with extensive bone defects, rather than filling the entire defect cavity. This strategy prevented an excessive increase in prosthesis volume and subsequent weight overload. Furthermore, for prostheses that remained relatively large in volume despite this approach, an expanded porous design was implemented to further reduce overall weight. The assembled component was designed only when the prosthesis featured an elongated protrusion directed toward the ischium or pubis. This design allowed for intraoperative abandonment of the protrusion if its installation proved challenging. Otherwise, all prostheses in this study followed a monolithic design.
Based on the characteristics of bone surface preparation tools used during surgery, such as burrs and curettes, and general surgical principles, two senior surgeons performed smoothing and rounding modifications on the reconstructed internal surface of the bone defect cavity. This step aimed to prevent the prosthesis from incorporating unnecessary, surgically impractical structural complexities that could increase intraoperative challenges. As a result, the final prosthesis design does not achieve a 100% match with the bone structure directly obtained from CT-based 3D reconstruction. However, this modification principle was consistently applied across all cases, ensuring uniformity in prosthesis optimization. To ensure consistency in prosthesis fixation among all cases, bone cement and bone grafts were strictly avoided for filling bone defects. With the exception of a few short screws that do not play a critical mechanical role, all prostheses were secured using cancellous screws of the same model, with a uniform diameter of 6.5 mm. Furthermore, no auxiliary fixation devices, including screw-rod systems, were utilized in any case. All prostheses were designed by the same designer following a consistent design framework, which encompassed uniform principles for defect filling, prosthesis fixation, and structural surface refinement. Upon multidisciplinary validation of structural rationality, the finalized prosthesis data were exported in x_t format. Print orientation optimization, support generation, and slicing were performed using 3-matic Medical (Materialise, Belgium) to prepare production-ready files.
All 3D-printed revision prostheses in this study were fabricated from Ti6Al4V titanium alloy using an Arcam EBM A1 electron beam melting 3D printer (Arcam AB, Sweden) following standardized manufacturing protocols.27 Detailed EBM system parameters were consistent with our prior technical documentation.28 The prostheses employed standard Arcam Ti6Al4V extra-low interstitial (ELI) powder (particle size: 45–100 μm) as the feedstock material,29 with nominal composition (wt.%) of 6.04% Al, 4.05% V, 0.013% C, 0.07% Fe, 0.13% O, <0.005% N and H, and balance of Ti. The bone-implant interface was designed with a porous lattice structure zone featuring a minimum thickness of 1.5 mm, target pore size of 300 μm, strut diameter of 0.3 mm, and designed porosity of 65%. The manufacturing parameters included an electron beam power of 300 W, an average build temperature of 680 °C, and a scanning speed of 400 mm/s, with full-process helium atmosphere protection.
The total printing duration was approximately 24 h. Post-printing procedures comprised 6-h cooling, followed by sequential steps: support structures removal, surface trimming, polishing, screw thread machining, and sandblasting. Finalized prostheses underwent 30-min ultrasonic cleaning in 75% ethanol and deionized water to eliminate impurities and residual titanium particles, followed by sterilization and aseptic packaging for surgical use. Quality control protocols mandated the concurrent printing of a standardized metallic specimen within each build chamber. Subsequent mechanical testing and microstructural characterization of these specimens were required prior to the clinical application of corresponding prostheses.
To enhance the structural quality of the prosthesis while reducing production costs and time, all cases followed a hybrid manufacturing approach that combined 3D printing and machine processing. Except for screw holes and assembly interfaces, all other components of the prosthesis were directly fabricated using 3D printing technology. The cancellous screw holes were printed as apertures and subsequently polished by machine processing to achieve a smooth screw contact surface. The locking screw holes were initially printed as truncated cones with a diameter of 6 mm, featuring a centrally located 1 mm spherical recess, and were further processed using a drill bit to create threads and complete the apertures. This standardized hybrid manufacturing principle of 3D printing combined with machine processing was consistently applied across all cases.
2.3. Processing of pelvic, prosthetic, and fixation element structural data
Comparative analysis was performed using preoperative digital planning models (prosthetic design data) and postoperative CT-derived reconstructions. Preoperative datasets were visualized in UG NX (Siemens PLM Software, Germany), displaying osseous pelvic anatomy and prosthetic geometry. Postoperative CT scans underwent volumetric reconstruction via Mimics Medical 20.0 (Materialise NV, Belgium), generating STL files of implanted prostheses. Two experienced physicians with extensive interdisciplinary expertise in medical engineering conducted a 3D reconstruction of the pelvic skeletal structures and metallic implants based on these CT data. The preoperative and postoperative CT slice thickness for all patients was set at 0.625 mm. The voxel resolution for all 3D-reconstructed structures was defined as an XY resolution of 0.9238 mm and a Z resolution of 0.8000 mm. The smoothing process was performed with 20 iterations and a smoothing factor of 0.2. To minimize the impact of metal artifacts on the surrounding bony structures, the operators avoided relying solely on CT value thresholding for bone segmentation in the affected regions. Instead, they meticulously analyzed the images layer by layer and manually delineated the inner surface of bone defect cavities to ensure the accuracy of the reconstructed 3D structures. These STL datasets underwent surface optimization in Geomagic Wrap (3D Systems, United States of America [USA]) before conversion to IGES format for parametric solid modeling in UG NX. Final integration created converged assemblies combining pelvic anatomy and prosthetic components.
2.4. Establishment of a standardized pelvic coordinate system for 3D-printed revision prosthesis evaluation
A patient-specific coordinate framework was constructed (Figure 1) in UG NX 12.0 using established anatomical landmarks.30 The definition of parameters in the framework is as follows:
(i) Frontal plane: Midpoint between bilateral anterior superior iliac spines (ASIS) and pubic tubercles.
(ii) Mid-sagittal plane: ASIS midpoint, pubic tubercle midpoint, and sacral base midline.
(iii) Origin: ASIS midpoint.
(iv) Axes: Y-axis: Intersection line of frontal and mid-sagittal planes (vertical); X-axis: Perpendicular to mid-sagittal plane through the origin (horizontal); Z-axis: Orthogonal to X–Y plane (sagittal)

Figure 1. Development of the standard 3D pelvic coordinate system. (A) Identification of the bilateral anterior superior iliac spine (ASIS) points, with B1 and B2 representing the ASIS landmarks. (B) Identification of the midpoint of the pubic tubercle, where C1 and C2 represent the bilateral pubic tubercle points, and C3 denotes their midpoint. (C) Construction of the pelvic frontal plane (P1). (D) Three-dimensional schematic representation of the pelvic frontal plane (P1). (E) Identification of the lowest points of the ischium, D1 and D2 (only D2 is displayed due to image overlap). (F) Selection of key anatomical landmarks of the pelvis. (G) Establishment of the mid-sagittal plane (green plane, P2), defined using three reference points: B3, C3, and D3. These points correspond to the midpoints of the bilateral ASIS landmarks (B1B2), bilateral pubic tubercle points (C1C2), and bilateral lowest points of the ischium (D1D2), respectively. (H) Three-dimensional schematic representation of the mid-sagittal plane (P2). (I) Definition of the coordinate system’s origin and X-axis. (J) Three-dimensional schematic representation of the X-axis. (K) Definition of the Y-axis of the coordinate system. (L) Establishment of the standardized 3D pelvic coordinate system. The updated image has been attached as a separate file in the email response.
This coordinate system was independently replicated for preoperative plans and postoperative CT reconstructions using identical methodology.
2.5. Quantification of prosthetic positional and angular deviation
Rotational centers were determined by various means:
(i) Preoperative: Geometric centroid calculation of cup edge arc in planning software
(ii) Postoperative: Best-fit sphere approximation of implanted cup edge in CT reconstruction
The 3D positional displacement (ΔP) was computed as:
where (xp, yp, zp) and (xa, ya, za) represent planned versus actual coordinates. Angular deviation (θ) was derived from vector analysis of cup edge perpendiculars:
where u and v denote preoperative and postoperative orientation vectors, respectively.
2.6. Volumetric overlap accuracy assessment
Postoperative prosthetic models were spatially registered to preoperative coordinates using iterative closest-point algorithms. Volumetric congruence (η) was calculated as:
where Boolean operations defined overlapping regions between planned/actual prostheses.
2.7. Inter- and intra-observer reliability analysis
Measurement variability was assessed through blinded duplicate evaluations by two musculoskeletal engineers and orthopedic surgeons. The protocol included an initial assessment (T0) and repeat evaluation after an 8-week washout period (T1). The deviation classification comprises: Grade I: < 4 mm; Grade II: 4–6 mm; Grade III: 6–8 mm; and Grade IV: ≥8 mm. Cohen’s κ statistics were evaluated using Landis–Koch criteria: κ < 0.40 indicates poor agreement; 0.40–0.75 indicates moderate agreement; and > 0.75 indicates excellent agreement,
2.8. Comparative assessment
A comparative assessment was performed between CT-based 3D and simulated radiographic measurement. X-ray simulation involved the following:
(i) Projection of cup edge perpendiculars onto coronal (XY) plane
(ii) Angular measurement between projected lines
(iii) Comparative analysis with 3D angular measurements
Outcome groups were compared using both methodologies to determine measurement system efficacy.
2.9. Statistical analysis
Data analysis was performed using SPSS Statistics (IBM, USA). For numerical values (e.g., prosthesis positional deviation), angular deviation and volume overlap accuracy were calculated for both groups, and the Shapiro-Wilk test was employed to assess normality. If the data did not follow a normal distribution, the Mann–Whitney U-test was used for comparative analysis. If normality was satisfied, the F-test was subsequently applied to assess the homogeneity of variances. For data with homogeneous variances, an independent-samples t-test was performed; for data with heterogeneity of variances, Welch’s t-test was employed.
The κ-value was calculated using the Chi-square test to assess the agreement of positional deviation level results obtained by two evaluators. A κ-value <0.40 indicated low agreement; values between 0.40 and 0.75 indicated medium agreement; and values >0.75 indicated high agreement. In all statistical calculations, p < 0.05 was considered statistically significant.
3. Results
3.1. Validation of measurement reliability in the pelvic 3D coordinate system
Figure 2 demonstrates the inter-and intra-observer consistency outcomes for prosthesis positional deviation grading. As detailed in Table 1, Cohen’s κ values revealed excellent intra-observer agreement (κ = 0.872 and κ = 0.758 for Observer 1 and 2, respectively) and exceptional inter-observer consistency (κ = 0.878). The consistent slice agreement rates reached 91% (10/11 cases) for both intra-observer (Observer 1) and inter-observer assessments, confirming the methodology’s reproducibility for subsequent analyses.

Figure 2. Results of two observers’ two-round calculations and grading of the 3D positional deviation of all cases.
Table 1. Statistical analysis of inter- and intra-observer consistency (N = 11)
| Observer consistency | κ | Consistent slices | Consistent rate |
|---|---|---|---|
| Intra-observer consistency 1 | 0.872 | 10 | 91% |
| Intra-observer consistency 2 | 0.758 | 9 | 82% |
| Inter-observer consistency | 0.878 | 10 | 91% |
3.2. Clinical correlation of 3D positional and angular accuracy
As quantified in Table 2 and visualized in Figure 3A–I, the better outcome cohort (HHS ≥ 80) demonstrated significantly lower 3D prosthetic deviations (positional deviation: 4.23 ± 1.30 mm vs. 8.47 ± 2.83 mm [p = 0.013]; angular deviation: 5.95° ± 1.41° vs. 10.48° ± 3.33° [p = 0.020]). Both parameters displayed normal distribution (Shapiro-Wilk p > 0.05) and variance homogeneity (Levene’s p > 0.05), enabling parametric analysis. The strong correlation between reduced geometric deviations and superior clinical outcomes validates the assessment protocol’s clinical relevance.
Table 2. Statistical analysis of 3D positional deviation of prostheses (N = 11)
| Coordinate | Better outcome group (n = 5) | Regular outcome group (n = 6) | t | p |
|---|---|---|---|---|
| Preoperative X-coordinate (mm) | –12.8060 ± 85.4849 | 1.3983 ± 97.3853 | –0.2542 | 0.8051 |
| Preoperative Y-coordinate (mm) | –52.4160 ± 3.2771 | –50.9433 ± 17.2877 | –0.2043 | 0.8456 |
| Preoperative Z-coordinate (mm) | –50.6920 ± 9.5677 | –56.8250 ± 8.2127 | 1.1457 | 0.2815 |
| Postoperative X-coordinate (mm) | –13.2900 ± 87.7524 | 2.1050 ± 97.9665 | –0.2717 | 0.7920 |
| Postoperative Y-coordinate (mm) | –51.3680 ± 3.3114 | –49.6067 ± 16.1474 | –0.2607 | 0.8038 |
| Postoperative Z-coordinate (mm) | –50.1940 ± 11.6539 | –56.4550 ± 7.2056 | 1.0947 | 0.3021 |
| 3D positional deviation of prostheses (mm) | 4.2280 ± 1.2957 | 8.4653 ± 2.8253 | –3.0743 | 0.0133 |
Table 3. Statistical analysis of 3D angular deviation of prostheses (N = 11)
| Data types | Better outcome group (n = 5) | Regular outcome group (n = 6) | t | p |
|---|---|---|---|---|
| 3D angular deviation of prostheses (degrees) | 5.9455 ± 1.4142 | 10.4829 ± 3.3273 | –2.8242 | 0.0199 |

Figure 3. Determination of 3D positional and angular deviations of the prosthesis. (A) Determination of the acetabular cup rim arc in preoperative planning data: yellow and red represent the preoperatively planned prosthesis structure; green represents the acetabular cup rim arc; and R0 is the center of the arc. (B) Determination of the acetabular cup rim arc in postoperative CT 3D reconstruction data: purple represents the prosthesis structure obtained from postoperative CT 3D reconstruction; green represents the acetabular cup rim arc; and R1 is the center of the arc. (C) Measurement of 3D positional deviation of the prosthesis: the yellow arc represents the cup rim arc in preoperative planning; the purple arc represents the cup rim arc obtained from postoperative CT 3D reconstruction; and the distance between their centers (i.e., R0 and R1) represents the 3D deviation between the actual postoperative position of the prosthesis and the preoperative planning. (D) Close-up of the measurement process for 3D positional deviation. (E) Measurement of 3D angular deviation of the prosthesis: yellow arrows and dashed lines represent the direction lines of the prosthesis in preoperative planning; purple arrows and dashed lines represent the direction lines of the prosthesis obtained from postoperative CT 3D reconstruction; and the angle between them represents the 3D deviation between the actual postoperative angle of the prosthesis and the preoperative planning. (F) Comparative analysis of the differences in preoperative prosthesis position coordinates. (G) Comparative analysis of the differences in postoperative prosthesis position coordinates. (H) Comparative analysis of the 3D positional deviation of the prosthesis demonstrates that the 3D positional deviation in the group with better outcomes is significantly lower than that in the group with regular outcomes. (I) Comparative analysis of the 3D angular deviation of the prosthesis demonstrates that the 3D angular deviation in the group with better outcomes is significantly lower than that in the group with regular outcomes, consistent with clinical patterns. Notably, after XY-plane projection (simulated X-ray measurement), the above differences disappear, indicating a significant decrease in conformity with clinical patterns. * denotes p < 0.05; ns denotes no significant difference, i.e., p > 0.05.
3.3. 3D prosthesis volume overlap accuracy analysis
Welch’s t-test analysis (Table 4; Figure 4A–E) revealed significantly higher volume overlap in the better outcome group (76.80% ± 2.76% vs. 62.58% ± 9.67%; p = 0.014). Despite variance heterogeneity (Levene’s p = 0.031), baseline volumetric comparisons displayed no inter-group differences in design volume (p = 0.545) or absolute overlap volume (p = 0.964), validating the proportional metric.
Table 4. Statistical analysis of the 3D prosthesis volume overlap accuracy (N = 11)
| Data Types | Better outcome group (n = 5) | Regular outcome group (n = 6) | t | p |
|---|---|---|---|---|
| Design volume (mm³) | 81357.8 ± 33790.8 | 96522.8 ± 44035.1 | –0.6291 | 0.5449 |
| Overlap volume (mm³) | 62712.6 ± 26938.2 | 61850.0 ± 33078.1 | 0.0467 | 0.9638 |
| 3D prosthesis volume overlap accuracy (%) | 76.80 ± 2.76 | 62.58 ± 9.67 | 3.437 | 0.0140 |

Figure 4. Determination of 3D volume overlap accuracy of the prosthesis. (A) Schematic representation of the overlap between postoperative prostheses and preoperative planning in all cases: yellow represents the region of the preoperatively planned prosthesis; purple represents the region of the prosthesis obtained from postoperative CT 3D reconstruction; and red represents the overlapping region between the two. (B) Close-up of the overlap between postoperative prostheses and preoperative planning. (C) Morphological display of the overlap between preoperative and postoperative prostheses in each case, demonstrating that most of these are irregular geometric structures that are difficult to analyze using conventional methods. (D) Inter-group comparison of the volume of the preoperatively planned prosthesis and the volume of overlapping prosthesis regions, showing no significant difference between the two groups, thereby ruling out potential result bias caused by data differences (i.e., the reference value for subsequent comparisons of overlapping volume ratios). (E) Inter-group comparison of the ratio of overlapping prosthesis volume to the total volume of the preoperatively planned prosthesis, demonstrating that the group with better outcomes has a significantly higher overlap accuracy rate than the group with regular outcomes. * denotes p < 0.05; ns denotes no significant difference, i.e., p > 0.05.
3.4. Superiority of 3D CT analysis over simulated X-ray
Table 5 demonstrates the critical limitation of simulated X-ray measurements. While 3D CT analysis revealed significant angular deviations (p = 0.020), projected XY-plane measurements displayed non-significant differences (3.93° ± 1.73° vs. 7.68° ± 3.64°; p = 0.065). This 63.6% reduction in discriminative power (from p < 0.05 to p > 0.05) confirms the necessity of 3D spatial analysis for accurate postoperative assessment.
Table 5. Statistical analysis of prosthesis angular deviation by simulated X-ray radiography (N = 11)
| Data types | Better outcome group (n = 5) | Regular outcome group (n = 6) | t | p |
|---|---|---|---|---|
| Angle deviation on XY-plane (degrees) | 3.9259 ± 1.7290 | 7.6767 ± 3.6447 | –2.0990 | 0.0652 |
4. Discussion
Contemporary CT-based 3D evaluation methods demonstrate superior accuracy in prosthesis positioning by eliminating perspective errors and anatomical superimposition inherent in radiographs and 2D CT. Henckel et al.15 established that CT-derived angular measurements of hip prostheses displayed significantly smaller deviations from mechanical arm-derived reference values compared to 2D techniques. Davda et al.31 further validated the enhanced reliability of CT reconstruction for acetabular angle quantification. While alternative X-ray methods utilizing projected prosthesis contours theoretically distribute measurement errors,25 their accuracy remains inferior to volumetric CT analysis. Schumann et al.18 systematically documented the limitations of planar radiographic assessment in geometric fidelity and measurement reproducibility.
Despite these advantages, current CT evaluation systems exhibit critical limitations when applied to 3D-printed personalized revision prostheses,32–39 particularly regarding adaptability to non-standard geometries and robustness in complex anatomical scenarios. Conventional algorithms dependent on standardized acetabular rim geometry15,16,22,31,40 or intact spherical surfaces for rotational center calculation prove inadequate for custom prostheses. Our protocol addresses this issue through volumetric overlap accuracy assessment between preoperative planning and postoperative positioning, demonstrating superior clinical relevance for irregular implants (76.80 ± 2.76% vs. 62.58 ± 9.67%; p = 0.014). Unlike traditional methods focusing solely on postoperative metrics, our 3D alignment analysis incorporates critical parameters such as defect-filling efficacy—factors that exhibit a stronger outcome correlation than conventional angle metrics.41
The second limitation manifests in compromised reliability with extensive periacetabular defects or iliac deformities.18,31 Our multi-anchor reference system employing six biomechanically stable landmarks (including bilateral ischial tuberosities) reduced positioning error variance versus anterior pelvic plane systems in iliac deformity cases.19,30,42 The prosthesis placement in this study demonstrated a high level of surgical quality and positional accuracy, ensuring the reliability of the study’s conclusions. In the better outcome group, the total spatial deviation of the prosthesis position in 3D space was approximately 4.2 mm (equivalent to a positional deviation of 1.18 mm along each of the X-, Y-, and Z-axes). In contrast, recent studies on the accuracy of prosthesis positioning in hip revision surgery have reported deviations exceeding 5 mm in a single direction along the longitudinal axis of the lower limb (comparable to the Y-axis in this study), even with the assistance of surgical navigation systems.43 These findings highlight the exceptional accuracy of prosthesis positioning achieved in this study.
The 3D standardized pelvic coordinate system and volumetric assessment protocol developed in this investigation demonstrated superior capability in quantifying true prosthesis positioning accuracy. Notably, radiographic projection simulations induced substantial spatial information degradation, particularly compromising angular measurement precision. This dimensional reduction converted statistically significant 3D angular deviation into non-significant 2D radiographic measurements, illustrating the fundamental limitations of projection-based assessment. The observed obscuration of critical spatial relationships under simulated X-ray conditions objectively validates the diagnostic superiority of our stereotactic evaluation framework over conventional 2D methodologies.
Notwithstanding these advancements, two principal limitations warrant consideration. Firstly, the cohort size remains constrained by the specialized application of 3D-printed personalized revision prostheses in complex acetabular defects. This technological novelty inherently limits case accumulation velocity (mean recruitment rate: 1.2 cases/month vs. 4.7 for standard revisions). Future investigations should prioritize multicenter collaborations to achieve adequate statistical power for subgroup analysis. Secondly, the single-institution design introduces potential selection bias, though mitigated by consecutive enrollment protocols. Planned expansion to six tertiary arthroplasty centers will enhance generalizability while maintaining surgical standardization through our engineering-guided implantation protocol. These methodological refinements are particularly crucial for validating the observed 3D accuracy thresholds across diverse anatomical variants and institutional practice patterns.
5. Conclusion
The 3D stereotactic accuracy assessment system developed in this investigation for patient-specific 3D-printed acetabular revision prostheses demonstrates significant concordance with clinical outcome stratification. This method provides a robust framework for optimizing perioperative decision-making in complex revision scenarios, particularly demonstrating exceptional reliability, generalizability across complex anatomical variants, and translational potential for precision arthroplasty applications. The methodological innovations in volumetric overlap analysis and multi-anchor coordinate referencing establish this paradigm as a clinically validated tool for enhancing procedural accuracy in pelvic reconstructions with extensive bone loss.
1.Zheng W, Liu X, Mei R, et al. Feasibility and anteversion accuracy of a patient-specific instrument for femoral prosthesis implantation in total hip arthroplasty. Biomed Eng Online. 2023;22(1):90.
doi: 10.1186/s12938-023-01152-5
2.Miner SA, Martucci JA, Brigido SA, DiDomenico L. Time to revision after periprosthetic joint infection in total ankle arthroplasty: a systematic review. J Foot Ankle Surg. 2023;62(1):186-190.
doi: 10.1053/j.jfas.2022.09.001
3.Rizk AA, Jella TK, Cwalina TB, Pumo TJ, Erossy MP, Kamath AF. Are trends in revision total joint arthroplasty sustainable? declining inflation-adjusted medicare reimbursement for hospitalizations. J Arthroplasty. 2023;38(7 Suppl 2):S91-S96.
doi: 10.1016/j.arth.2022.10.030
4.Springer BD. Irrigation solutions and antibiotic powders: should I use them in primary and revision total joint arthroplasty? J Arthroplasty. 2022;37(8):1438-1440.
doi: 10.1016/j.arth.2022.02.096
5.Tarabichi S, Verhey JT, Vink MC, et al. What is the most optimal bearing surface for minimizing instability after revision total hip arthroplasty? J Arthroplasty. 2025;40(2S1):S182-S184.
doi: 10.1016/j.arth.2024.10.033
6.Velasquez Garcia A, Bukowiec LG, Yang L, et al. Artificial intelligence-based three-dimensional templating for total joint arthroplasty planning: a scoping review. Int Orthop. 2024;48(4):997-1010.
doi: 10.1007/s00264-024-06088-6
7.Li FL, Qi XY, Chen JL, Zeng YR. From disease management to prevention, hip prosthesis joint infections in the past 20 years: a global research trends and top 10 cited articles analysis. Front Surg. 2025;11:1448049.
doi: 10.3389/fsurg.2024.1448049
8.Ong KL, Lau E, Suggs J, Kurtz SM, Manley MT. Risk of subsequent revision after primary and revision total joint arthroplasty. Clin Orthop Relat Res. 2010;468(11):3070-3076.
doi: 10.1007/s11999-010-1399-0
9.Andrzejewski K, Domżalski M, Komorowski P, Poszepczyński J, Rokita B, Elgalal M. Optimization of revision hip arthroplasty workflow by means of detailed pre-surgical planning using computed tomography data, open-source software and three-dimensional-printed models. Diagnostics (Basel). 2023;13(15):2516.
doi: 10.3390/diagnostics13152516
10.Ren Z, Yang WQ. Development of a navigation tool for revision total hip surgery based on electrical impedance tomography. IEEE Trans Instrum Measure. 2016;65(12):2748-2757.
11.Zampelis V, Flivik G. Custom-made 3D-printed cup-cage implants for complex acetabular revisions: evaluation of pre-planned versus achieved positioning and 1-year migration data in 10 patients. Acta Orthop. 2021;92(1):23-28.
doi: 10.1080/17453674.2020.1819729
12.Patel A, Pavlou G, Mújica-Mota RE, Toms AD. The epidemiology of revision total knee and hip arthroplasty in England and Wales: a comparative analysis with projections for the United States. A study using the National Joint Registry dataset. Bone Joint J. 2015;97-b(8):1076-1081.
doi: 10.1302/0301-620x.97b8.35170
13.Hasegawa K, Kabata T, Kajino Y, Inoue D, Tsuchiya H. Periprosthetic occult fractures of the acetabulum occur frequently during primary THA. Clin Orthop Relat Res. 2017;475(2):484-494.
doi: 10.1007/s11999-016-5138-z
14.Lu X, Zhang Z, Wang W, Xu H, Zhang H. Accuracy and safety of a new robotic arm for both femoral and acetabular side in total hip arthroplasty: a cadaveric study. J Orthop Surg Res. 2023;18(1):830.
doi: 10.1186/s13018-023-04263-w
15.Henckel J, Ramesh A, Hothi H, Richards R, Di Laura A, Hart A. The accuracy and precision of acetabular implant measurements from CT imaging. Front Bioeng Biotechnol. 2023;11:1150061.
doi: 10.3389/fbioe.2023.1150061
16.Li Q, Chen X, Lin B, Ma Y, Liao JX, Zheng Q. Three-dimensional technology assisted trabecular metal cup and augments positioning in revision total hip arthroplasty with complex acetabular defects. J Orthop Surg Res. 2019;14(1):431.
doi: 10.1186/s13018-019-1478-1
17.Sugano N, Takao M, Sakai T, Nishii T, Miki H. Does CT-based navigation improve the long-term survival in ceramic-on-ceramic THA? Clin Orthop Relat Res. 2012;470(11):3054-3059.
doi: 10.1007/s11999-012-2378-4
18.Schumann S, Sato Y, Nakanishi Y, et al. Cup implant planning based on 2-D/3-D radiographic pelvis reconstruction-first clinical results. IEEE Trans Biomed Eng. 2015;62(11):2665-2673.
doi: 10.1109/tbme.2015.2441378
19.Palit A, King R, Pierrepont J, Williams MA. Development of bony range of motion (B-ROM) boundary for total hip replacement planning. Comput Methods Programs Biomed. 2022;222:106937.
doi: 10.1016/j.cmpb.2022.106937
20.Cao L, Wang Y, Zou S, Cheng H. A novel positioner for accurately sitting the acetabular component: a retrospective comparative study. J Orthop Surg Res. 2019;14(1):279.
doi: 10.1186/s13018-019-1331-6
21.Bayraktar V, Weber M, von Kunow F, et al. Accuracy of measuring acetabular cup position after total hip arthroplasty: comparison between a radiographic planning software and three-dimensional computed tomography. Int Orthop. 2017;41(4):731-738.
doi: 10.1007/s00264-016-3240-1
22.Yamada K, Endo H, Tetsunaga T, Miyake T, Sanki T, Ozaki T. Accuracy of cup positioning with the computed tomography-based two-dimensional to three-dimensional matched navigation system: a prospective, randomized controlled study. J Arthroplasty. 2018;33(1):136-143.
doi: 10.1016/j.arth.2017.08.001
23.Fischer MCM, Tokunaga K, Okamoto M, Habor J, Radermacher K. Preoperative factors improving the prediction of the postoperative sagittal orientation of the pelvis in standing position after total hip arthroplasty. Sci Rep. 2020;10(1):15944.
doi: 10.1038/s41598-020-72782-1
24.Hayashi S, Hashimoto S, Kuroda Y, et al. Accuracy of cup position following robot-assisted total hip arthroplasty may be associated with surgical approach and pelvic tilt. Sci Rep. 2021;11(1):7578.
doi: 10.1038/s41598-021-86849-0
25.Murphy MP, Killen CJ, Ralles SJ, Brown NM, Hopkinson WJ, Wu K. A precise method for determining acetabular component anteversion after total hip arthroplasty. Bone Joint J. 2019;101-b(9):1042-1049.
doi: 10.1302/0301-620x.101b9.Bjj-2019-0085.R1
26.Chang CY, Wu CT, Numan H, Kuo FC, Wang JW, Lee MS. Survival analysis of allografting and antiprotrusio cage in treating massive acetabular bone defects. J Arthroplasty. 2021;36(2):682-687.
doi: 10.1016/j.arth.2020.08.050
27.Hao YQ, Wang L, Jiang WB, et al. 3D printing hip prostheses offer accurate reconstruction, stable fixation, and functional recovery for revision total hip arthroplasty with complex acetabular bone defect. Engineering. 2020;6(11):1285-1290.
doi: 10.1016/j.eng.2020.04.013
28.Murr LE, Amato KN, Li SJ, et al. Microstructure and mechanical properties of open-cellular biomaterials prototypes for total knee replacement implants fabricated by electron beam melting. J Mech Behav Biomed Mater. 2011;4(7):1396-1411.
doi: 10.1016/j.jmbbm.2011.05.010
29.Murr LE, Gaytan SM, Medina F, et al. Next-generation biomedical implants using additive manufacturing of complex, cellular and functional mesh arrays. Philos Trans A Math Phys Eng Sci. 2010;368(1917):1999-2032.
30.Fischer MCM, Krooß F, Habor J, Radermacher K. A robust method for automatic identification of landmarks on surface models of the pelvis. Sci Rep. 2019;9(1):13322.
doi: 10.1038/s41598-019-49573-4
31.Davda K, Smyth N, Cobb JP, Hart AJ. 2D measurements of cup orientation are less reliable than 3D measurements. Acta Orthop. 2015;86(4):485-490.
doi: 10.3109/17453674.2015.1017791
32.D’Isidoro F, Chênes C, Ferguson SJ, Schmid J. A new 2D-3D registration gold-standard dataset for the hip joint based on uncertainty modeling. Med Phys. 2021;48(10):5991-6006.
doi: 10.1002/mp.15124
33.Hidaka R, Matsuda K, Nakamura M, Nakamura S, Kawano H. Optimal combined anteversion range for obtaining a wider range of motion without prosthetic impingement after total hip arthroplasty: a three-dimensional analysis study. J Orthop Surg Res. 2022;17(1):226.
doi: 10.1186/s13018-022-03112-6
34.Tsutsui T, Goto T, Wada K, Takasago T, Hamada D, Sairyo K. Efficacy of a computed tomography-based navigation system for placement of the acetabular component in total hip arthroplasty for developmental dysplasia of the hip. J Orthop Surg (Hong Kong). 2017;25(3):2309499017727954.
35.Sariali E, Boukhelifa N, Catonne Y, Pascal Moussellard H. Comparison of three-dimensional planning-assisted and conventional acetabular cup positioning in total hip arthroplasty: a randomized controlled trial. J Bone Joint Surg Am. 2016;98(2):108-116.
doi: 10.2106/jbjs.N.00753
36.Tsai TY, Dimitriou D, Li JS, Kwon YM. Does haptic robot-assisted total hip arthroplasty better restore native acetabular and femoral anatomy? Int J Med Robot. 2016;12(2):288-295.
doi: 10.1002/rcs.1663
37.Pongkunakorn A, Wongkamthong N, Ruktrakul R. Cup positioning relative to the acetabular rim planned with three-dimensional computed tomography improves precision in total hip arthroplasty: a randomized controlled trial. J Orthop Surg Res. 2025;20(1).
doi: 10.1186/s13018-025-05704-4
38.Weber M, Woerner M, Craiovan B, et al. Current standard rules of combined anteversion prevent prosthetic impingement but ignore osseous contact in total hip arthroplasty. Int Orthop. 2016;40(12): 2495-2504.
doi: 10.1007/s00264-016-3171-x
39.Liang J, Zhao Y, Gao X, Fang X, Xu Y, Lu S. Design of custom-made navigational template of femoral head and pilot research in total hip resurfacing arthroplasty. BMC Surg. 2020;20(1):144.
doi: 10.1186/s12893-020-00807-7
40.Nodzo SR, Chang CC, Carroll KM, et al. Intraoperative placement of total hip arthroplasty components with robotic-arm assisted technology correlates with postoperative implant position: a CT-based study. Bone Joint J. 2018;100-b (10):1303-1309.
doi: 10.1302/0301-620x.100b10-bjj-2018-0201.R1
41.Hevesi M, Wyles CC, Rouzrokh P, et al. Redefining the 3D topography of the acetabular safe zone: a multivariable study evaluating prosthetic hip stability. J Bone Joint Surg Am. 2022;104(3):239-245.
42.Yang Y, Ma Y, Li Q, et al. Three-dimensional morphological analysis of true acetabulum in Crowe type IV hip dysplasia via standard-sized cup-simulated implantation. Quant Imaging Med Surg. 2022;12(5):2904-2916.
doi: 10.21037/qims-21-803
43.Tang A, Singh V, Sharan M, et al. The accuracy of component positioning during revision total hip arthroplasty using 3D optical computer-assisted navigation. Eur J Orthop Surg Traumatol. 2023;33(5):1989-1995.